Central Queensland property investment in 2026 means entry from around $412,000 with house yields past 6%. Gladstone, Rockhampton, Bundaberg and Mackay each run on a different economic engine. Each also carries a bust in its recent history that shapes how you should buy today.
Why Central Queensland in 2026
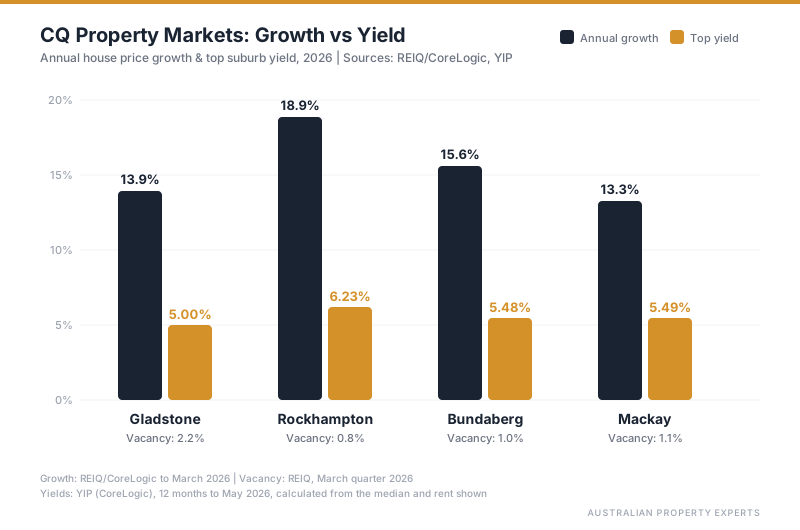
The four suburbs in our comparison table grew between 7.0% and 16.5% in the year to June 2026 (YIP). Postcode vacancy rates sit between 0.8% and 1.7% (SQM Research, August 2026). That is well below the REIQ’s 2.6-3.5% “healthy” range (REIQ). Entry prices start from around $412,000 in Rockhampton City. Gross house yields run from about 4.3% in the premium family suburbs to 6.3% in the city core. The combined-capitals house average is 3.3% (Cotality, August 2026).
More than $5 billion of infrastructure is committed across the region. That covers a $1.98 billion Rockhampton ring road, a $1.2 billion Bundaberg hospital and a $2 billion smelter deal in Gladstone. There’s also a Mackay hospital expansion costed at about $520 million. The first three are under construction or contracted. Mackay’s main hospital works start in 2027.
These are also the towns that burned investors last cycle. Gladstone prices more than halved between 2012 and 2017. Mackay dropped by a quarter. Before buying here, it pays to understand what has changed since then.
Gladstone: Industry and the Smelter Deal
Gladstone’s economy sits on three LNG plants, one of Australia’s largest multi-commodity ports and the Boyne aluminium smelter. In March 2026, Rio Tinto and the state and federal governments signed a $2 billion, ten-year deal. It secures the smelter to at least 2040 (Rio Tinto, March 2026). That locks in 1,000 direct jobs at BSL, part of more than 3,000 Rio Tinto jobs in Gladstone.
West Gladstone has the town’s strongest house yield. A $530,000 median, $500 a week in rent and 150 sales in the year to June 2026 work out at a 4.91% gross yield (YIP). Gladstone Central sits at $543,500 on $460 a week, a 4.40% yield. Its headline 45.81% annual growth comes off just 34 sales (YIP). Treat that growth figure as noise rather than signal. Thirty-four sales is not enough to set a median reliably, which is why we price Gladstone off West Gladstone comparables instead.
The vacancy rate in the 4680 postcode is 1.7% (SQM Research, August 2026). That is the highest of these four towns and the number to watch. The rate is still below the REIQ’s “healthy” range. But it does mean street-level selection matters more here than in Rockhampton or Bundaberg. The suburbs closest to industry and the hospital draw the deepest tenant pools.
For suburb-level detail, see our Gladstone buyers agent page.
Rockhampton: Yield and Growth in One Town
Rockhampton’s established suburbs kept rising through the year to June 2026. West Rockhampton houses grew 19.1% and sold in a median of 12 days (YIP).
Vacancy is 0.8% in the 4700 postcode that covers the city core. Across the three main Rockhampton postcodes it is about 1.1% (SQM Research, August 2026). Rockhampton City is both the most affordable way in and the best yield in this guide. A $412,000 median on $500 a week works out at 6.31% gross (YIP). West Rockhampton runs $600,000 on $550 for 4.77% (YIP).
The family belt costs more and yields less. Frenchville at $695,000 on $580 gives 4.34%. Norman Gardens at $731,000 on $620 gives 4.41%. Frenchville still put on 21.2% in the year and Norman Gardens 14.5%.
Rockhampton had 85,794 people in the local government area at June 2025 (ABS via profile.id). It is also the most economically diversified of the four. Beef processing, defence training at Shoalwater Bay, CQUniversity and the Base Hospital spread the tenant base across industries that do not move together. The $1.98 billion Rockhampton Ring Road moved into main construction in mid-2025 (TMR Queensland). That kind of multi-year build creates employment that flows directly into rental demand.
For anyone weighing capital growth against rental yield, Rockhampton lets you pick either end in one town. Buy Rockhampton City for yield. Buy Frenchville for growth.
For suburb breakdowns, see our Rockhampton buyers agent page.
Bundaberg: Migration and Medicine
Bundaberg prices kept climbing while most investors were watching the capitals. Dwelling values in the Bundaberg region grew 13.2% in the year to August 2026, reaching a median of $706,275 (Cotality, August 2026).
The next decade’s demand driver is already funded. The $1.2 billion new Bundaberg Hospital is the largest health infrastructure investment ever delivered in the Wide Bay region (Queensland Government, August 2026). Piling has started. Main works begin later this year. That means hundreds of construction jobs during the build, then permanent healthcare positions for years after.
Bundaberg South sits at a $565,000 median on $580 a week, a 5.34% gross yield. It had 64 sales and 16.49% growth in the year to June 2026 (YIP). Vacancy in the 4670 postcode sits at 1.1% (SQM Research, August 2026).
Bundaberg’s economic base is what sets it apart. Agriculture and food manufacturing do not ride commodity cycles the way coal and gas do. Bundaberg also had the second-largest net internal migration of any regional Queensland LGA in 2021-22 (QGSO, 2023 edition). Together, those mean rental demand doesn’t depend on a single industry.
For suburb-level analysis, see our Bundaberg buyers agent page.
Mackay: Bowen Basin Cash Flow
Mackay is the services capital for the Bowen Basin, the source of most of Australia’s metallurgical coal. That means higher wages and higher rents.
South Mackay houses sit at a $628,500 median on $650 a week, a 5.38% gross yield, on 135 sales in the year to June 2026 (YIP). That is the highest rent of any suburb in this guide. Rockhampton City still yields more, though, because it costs so much less to buy. Vacancy in the 4740 postcode is 1.2% (SQM Research, August 2026). The Mackay Base Hospital expansion, now costed at about $520 million, starts main works in 2027 (ABC, August 2026).
Mackay’s reliance on coal carries its own risk. When metallurgical coal prices collapsed in 2014-2015, the median house price fell from $419,500 in 2014 to $320,000 in 2017 (Domain). That is a drop of roughly a quarter.
The coal industry is now in its operational phase. The mines are producing, and more of the workforce now lives in Mackay permanently rather than in temporary camps. Mackay’s economy has also broadened into sugar, aquaculture, and healthcare. The conditions that caused the last bust are different, but the concentration in coal services has not disappeared.
For suburb-level data, see our Mackay buyers agent page.
What the Last Bust Teaches You
Gladstone’s average property price more than halved, from around $425,000 in 2012 to roughly $175,000 by 2017. By then, more than 80% of sales were at a loss (The New Daily, March 2018). Mackay dropped from $419,500 to $320,000. The Central Highlands, in the heart of the coal basin, fell from $360,000 to $191,250.
Three things made those busts so severe.
First, prices were inflated by a construction workforce that left when the LNG and mining projects ended. Second, investors bought project-dependent stock, houses in estates marketed to the boom in locations that had no demand without it. Third, vacancy spiked because the tenant base was temporary.
Today’s CQ markets are different on all three counts. The LNG plants are operating, not being built. The smelter is government-secured to 2040. Postcode vacancy across the four towns ranges from 0.8% to 1.7%. SQM Research recorded 12.3% in Gladstone’s 4680 postcode in April 2016. We buy established houses in the suburbs that held up through the downturn.
That history is why you check flood mapping and tenant demand block by block before buying in CQ. The suburb you pick matters more here than in most markets.
Four Towns Side by Side
| Town | Suburb | Median | Yield | Vacancy | Suburb growth |
|---|---|---|---|---|---|
| Rockhampton | Rockhampton City | $412,000 | 6.31% | 0.8% | 7.0% |
| Mackay | South Mackay | $628,500 | 5.38% | 1.2% | 15.3% |
| Bundaberg | Bundaberg South | $565,000 | 5.34% | 1.1% | 16.5% |
| Gladstone | West Gladstone | $530,000 | 4.91% | 1.7% | 15.2% |
Suburb medians and growth from YIP (CoreLogic), 12 months to June 2026, with rents to August 2026. Yields are rent x 52 divided by the median. Vacancy is SQM Research, August 2026, for each suburb’s postcode.
Which Town Fits Your Strategy
Maximum cash flow. Rockhampton City at 6.31% on a $412,000 median, where the low entry price and 0.8% vacancy do the work. South Mackay pays the highest rent at $650 a week. You buy in over $200,000 higher, though.
Growth with yield balance. Bundaberg or Mackay. Bundaberg South and South Mackay both grew more than 15% in the year with yields above 5.3%.
Least reliant on commodities. Bundaberg, then Rockhampton. Agriculture, healthcare and beef processing do not move with coal or gas prices.
Lowest entry point. Rockhampton City at around $412,000. It also has the highest yield in this guide.
If you are buying investment property interstate, CQ is a region where local knowledge matters more than most. Flood mapping, street-level tenant demand and bust-recovery patterns vary block by block. We run every candidate through our 12-point suburb scorecard before it makes a shortlist. For how these four sit against Brisbane, Townsville, Cairns and Toowoomba, see our Queensland buyers agent overview.
This is general information only and not financial advice. Speak to a qualified professional before making investment decisions.
If you want the yield, growth, and due-diligence numbers run on a specific CQ town, book a free discovery call.
Sources:
- REIQ - Time for a reset to ease Queensland’s rental market pressures (healthy vacancy range)
- SQM Research - vacancy rates by postcode, August 2026
- Cotality - Home Value Index, September 2026
- Rio Tinto - Boyne aluminium smelter deal, March 2026
- YIP - Gladstone Central suburb profile
- YIP - West Gladstone suburb profile
- YIP - Rockhampton City suburb profile
- YIP - West Rockhampton suburb profile
- YIP - Frenchville suburb profile
- YIP - Norman Gardens suburb profile
- YIP - Bundaberg South suburb profile
- YIP - South Mackay suburb profile
- TMR Queensland - Rockhampton Ring Road
- ABS via profile.id - Rockhampton population estimate
- Queensland Government - New Bundaberg Hospital major contractor
- ABC - Mackay Base Hospital expansion masterplan
- QGSO - Population growth highlights, Queensland regions
- Domain - Mining regions and the property market
- The New Daily - Gladstone property bust