Buyers Agent Tamworth
West Tamworth grew 31.58% to a $500,000 median. Calala grew 6.34% to $730,000. The most affordable suburb ran almost five times faster than the dearest, on a higher yield too. That's why the suburb is the decision here.
Investment Property Specialists
Tamworth does not have a property market. It has six of them, and they went in different directions last year. West Tamworth rose 31.58% at a $500,000 median while Calala rose 6.34% at $730,000. Yield broadly runs the other way to price. Any guide quoting one Tamworth median is describing a market nobody can buy in. The Tamworth locality itself recorded just 4 house sales, while the six suburbs around it traded 865 houses.
Every property gets judged on rental demand, cash flow and long-term growth, never on the city's headline number. We're Australian Property Experts, an investment-only buyers agency on a flat fee with no developer commissions. Our founder Peter Ly owns 17+ investment properties and has bought 300+ more for clients across every state. If you're weighing an affordable high-yield suburb against a dearer one, start with how growth and yield work together in a portfolio.
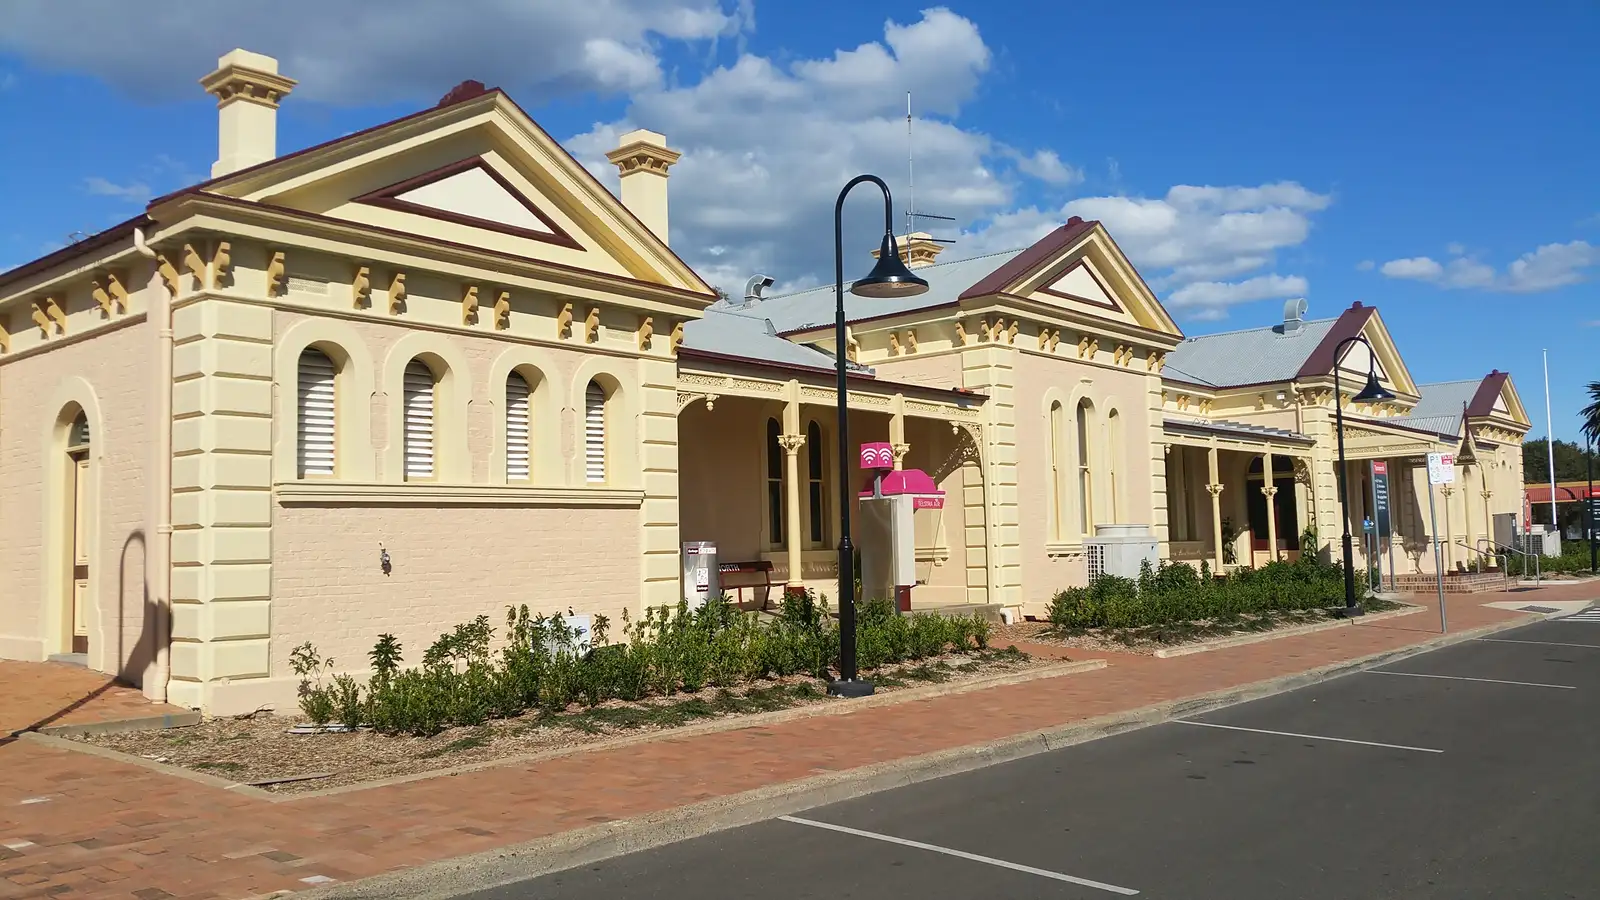
Tamworth Regional LGA held 66,403 residents at 30 June 2025. The economy produced $5.10 billion of gross regional product, up 3.79% in 2024-25 against 0.72% for NSW as a whole. Total jobs reached 36,034, a gain of 5,710 over five years. Unemployment was 3.4% in March 2026 against 4.1% for regional NSW. Tamworth Hospital anchors that base, after the $211 million Stage 2 redevelopment added medical, surgical, maternity, paediatric and emergency capacity.
Five things that decide a Tamworth purchase.
West Tamworth's median was $500,000 and Calala's was $730,000 over the same twelve months. Growth spread just as far, from 6.34% in Calala to 31.58% in West Tamworth. Yield ran from 4.07% to 4.68%. Picking the city is the easy part. Picking the suburb is the part that decides your return.
The six suburbs we buy in traded 865 houses in the twelve months to 30 June 2026. South Tamworth alone did 174 and North Tamworth did 166. That's enough turnover to buy without chasing and to sell without waiting years. We still run every candidate through our 12-point scorecard before it earns a place on your shortlist.
Health care and social assistance accounts for 6,305 jobs in Tamworth, or 17.5% of employment against 15.7% across NSW. It added 1,128 roles in five years. Construction follows at 4,713 jobs, up 2,015, then retail at 4,027 and education at 3,307. Agriculture holds 2,244 jobs, 6.2% of the total against 1.8% statewide. That is a stable tenant base, and it is also a concentration. We set out what that means under what to weigh up.
If you live in Sydney, Brisbane or interstate, you are not making the drive for a Saturday inspection. We handle inspections, due diligence, negotiation and settlement coordination on your behalf. You get the data and the photos, then make the call from wherever you are.
We're not paid by developers. We don't sell house-and-land packages or take rebates from selling agents. One fee, one client, no commission from anybody selling. In a year when Tamworth approved 412 new dwellings, that independence matters more than usual.
Tamworth has seven main residential suburbs and we buy across six of them. The pattern is consistent enough to plan around. The more affordable suburbs broadly pay more rent per dollar and clear faster, while the dearer ones sit longer and grew far less last year. If you like comparing towns side by side, our read on the neighbouring region is in our Central West NSW investment breakdown.
The lowest entry price of the six, the strongest year by a distance and the best house yield of the lot.
The busiest house market of the six and the quickest to clear. Buyers move on stock here in about three weeks.
Priced between the affordable and premium ends, it behaves like the affordable end on selling time.
Home to the dearest units of the six at a $532,000 median. Houses take 48 days to sell. That's level with Calala as the slowest of the six.
The established end of the market and last year the second-slowest grower of the six. It commands the second highest rent at $570 a week.
Calala is the dearest of the six and has the highest rent, at $620 a week. It was also last year's slowest grower. Yield holds up better than in the other two premium suburbs, at 4.42%.
Yields look strong on paper outside North Tamworth. But sale counts are small and two of the four suburbs went backwards. We buy units here selectively, if at all.
146 rentals sat vacant out of 7,166 monitored in August 2026. That is still tight in absolute terms. The rate has risen in four of the last six months, though.
Unit stock in the suburbs where one or two sales set the median, because that number tells you nothing about what your property is worth. Any address we cannot clear against the flood mapping behind the Peel River levees. Council's floodplain mapping is the place to start. Brand new house-and-land stock in a year when approvals hit their highest count in at least eight years, because the competing supply is still being built. And any suburb median we cannot cross-check, which is why one of Tamworth's seven residential suburbs is missing from the cards above.
No new builds and no project-marketed stock. Established properties, priced on what they earn now rather than what a brochure projects.
How It Works
Six steps, built from 300+ purchases. The point of them is that nothing about a Tamworth purchase happens to you by surprise.
The goal, the capacity, the timing and your appetite for a monthly shortfall. Tamworth either fits those or it does not.
The strategy session pins down your budget, your borrowing and your goal for this purchase. Then we test that against Tamworth suburb by suburb. A $500,000 buy in West Tamworth and a $730,000 buy in Calala are two different strategies, not two versions of one.
We search public listings and our off-market network across Tamworth and the surrounding New England and North West towns. The first shortlist is normally three to five properties. It takes two to four weeks to build.
For each shortlisted property, we run full due diligence including building and pest inspections, comparable sales analysis, and rental appraisals. In Tamworth we also check the address against the flood mapping. A levee protects the city, but the risk still varies street by street.
The number comes from comparable sales. A price guide is a marketing document, and we treat it as one.
From the accepted offer onward we coordinate the conveyancer, the broker and the property manager, and we finish at the signed lease rather than at settlement.
Typical timeline: 6 to 12 weeks. A property already in our off-market network shortens it; an SMSF or trust structure lengthens it.
You want rent that covers a bigger share of the mortgage. West Tamworth at 4.68% and South Tamworth at 4.58% are the yield end of Tamworth. Both sit under $550,000.
Sydney and Brisbane professionals who aren't spending weekends on the New England Highway. We inspect, verify and negotiate on your behalf. You get a report back with the numbers and the photos.
You already hold property and want a regional NSW addition that pays its way. You also want someone who knows which Tamworth suburb is running and which one has stalled.
You are buying NSW from another state or from overseas, which means trusting somebody else at the inspection. Our guide to buying interstate covers what changes when you can't visit.
A Self-Managed Super Fund or family trust purchase needs its structure in place first. We sequence NSW's bare trust requirements against the contract dates. Since 10 August 2026 an SMSF can no longer borrow to buy residential property, so a fund purchase now has to come from the balance you already hold.
You're making your first purchase. A sub-$550,000 entry price with a yield above 4.5% is what makes the numbers work. We'll walk you through every step and show you what we rejected as well as what we recommend.
Your Buyers Agent
Founder & Principal Buyers Agent
Peter spent almost a decade in banking and finance before turning a deep interest in property and data into Australian Property Experts. That analytical background shapes everything we do.
If Peter wouldn't buy it himself, he won't recommend it to a client. What he tells you comes from a portfolio he still owns rather than from a course he once did.
Tamworth pays you to be specific. Two suburbs in the same city delivered 31.58% and 6.34% over the same twelve months. The more affordable one also returned more yield, 4.68% against 4.42%. Markets that pay you for suburb-level homework are the ones worth doing it in.
The economy behind it is doing the job. Gross regional product grew 3.79% in 2024-25 while NSW managed 0.72%. The hospital redevelopment and cancer centre are built and running. Unemployment is 3.4% against 4.1% across regional NSW, though it has climbed from 1.9% a year earlier. Peter's caution is supply. Approvals hit their highest count in at least eight years and vacancy is climbing. This is a year to buy the right street rather than the city.
Based in Sydney, buying Australia-wide. Peter services Tamworth investors remotely with on-ground inspections and local market knowledge. We coordinate everything from contract to settlement.

We charge a clear flat fee based on the scope and complexity of your purchase. No percentage-based fees and no hidden charges.
Includes strategy session, property search (on and off-market), due diligence, negotiation and settlement coordination for a single residential purchase in Tamworth or the surrounding region.
SMSF, family trusts, company structures, or properties requiring development approval or subdivision analysis. The fee reflects the extra due diligence and specialist coordination required.
Custom Pricing
Buying 2-5+ properties across NSW or nationally? There is volume pricing for multiple purchases. We also plan the order of purchases so borrowing capacity carries through.
Why flat fees? Percentage-based fees create a conflict of interest: the more you pay for a property, the more the buyers agent earns. Our flat fee structure means we're incentivised to negotiate the best price, not push you toward expensive properties. See what our clients have bought in our case studies.
The obvious comparisons in the New England and North West are Armidale, Inverell and Dubbo.
Inland Rail does not run through Tamworth. Federal funding stopped at Parkes in May 2026. Only the Beveridge-to-Parkes section is being completed, so there is no Inland Rail benefit for Tamworth or anywhere else north of Parkes. Tamworth's freight case is its own intermodal facility at the Global Gateway Park.
The New England Renewable Energy Zone is centred around Armidale. EnergyCo names Tamworth as a population centre that can host future industries. The project itself is a regional-scale build with 6 GW of initial capacity and up to $24 billion of private investment. The declared boundary is centred on Armidale, so we do not count those construction jobs as Tamworth's.
Tamworth is not a growing logistics hub. The public spend on freight land is real. But transport, postal and warehousing employment fell by 271 jobs over five years to 1,367, or 3.8% of the workforce. We'd rather you knew that before you bought a rental near Taminda on a freight story.
Weighing up Tamworth against other markets? We're an investment property buyers agent working across every Australian state. The best market at any point in time is rarely the one you live in. The brief gets built around the numbers, not the postcode. For pricing see our buyers agent fees guide.
Background reading for any Tamworth investor before booking a call.
Get Started
A 15 minute call to understand your goals, your budget, and whether Tamworth is the right market for what you're trying to build.
A buyers agent represents the buyer, which sounds obvious until you notice nobody else in a property transaction does. The selling agent is paid by the vendor and the valuer works for the lender. We work for you.
The work is the shortlist, the due diligence, the price and the settlement nobody else is watching. In Tamworth that work starts at suburb level. The six suburbs we buy in ranged from 6.34% to 31.58% growth over the same twelve months.
Because the seller already has a professional on their side. You get local market knowledge, a negotiator who does it weekly, and off-market stock. It also saves the 40 to 60 hours a properly researched purchase takes. On a purchase this size the cost of choosing the wrong property dwarfs the fee.
Tamworth's case is a working regional economy with real choice inside it. Gross regional product reached $5.10 billion, up 3.79% in 2024-25 against 0.72% for NSW. Unemployment was 3.4% in March 2026 against 4.1% across regional NSW. Total jobs hit 36,034, up 5,710 over five years. The six suburbs we buy in recorded 865 house sales, so there is depth to buy into. The cautions are supply and rentals. Vacancy moved from 0.96% in August 2025 to 2.04% in August 2026. The 412 residential building approvals in 2025-26 were the highest count in at least eight years. Population growth also slowed to 0.53% in 2024-25, below regional NSW at 0.86%. Our read is that Tamworth still buys well at suburb level, but the days of every street rising together are behind it.
It depends on whether you want cash flow or a lower holding cost, because Tamworth's suburbs behave nothing alike. West Tamworth is the most affordable of the six we track, at a $500,000 median. It grew 31.58% on 145 sales while returning 4.68% at $450 a week. South Tamworth sits at $545,000 with 4.58% yield, 21.25% growth and the fastest selling time of the six at 23 days. At the other end, East Tamworth is $720,000 on 7.46% growth and 43 days. Calala is $730,000 on 6.34% growth and 48 days. The more affordable suburbs broadly pay more rent per dollar and clear faster, though the spread is narrow at 4.07% to 4.68%. We would not buy any of them sight unseen, because flood mapping behind the Peel River levees has to be checked address by address.
Data sources: suburb medians, growth, sale counts, and days on market are CoreLogic figures via Your Investment Property for the 12 months to 30 June 2026, and rents are CoreLogic medians to 31 August 2026, retrieved 26 September 2026. Gross yields are weekly rent x 52 / median. Vacancy rates are SQM Research by postcode, August 2026. Population is ABS estimated resident population at 30 June 2025, with regional NSW as the ABS Rest of NSW. Gross regional product and employment by industry are NIEIR figures for 2024-25 via economy.id, and unemployment is Small Area Labour Markets data for the March quarter 2026 via economy.id. Building approvals are ABS new residential approvals for Tamworth Regional LGA, 2025-26. Health projects are from NSW Health Infrastructure (updated July 2026) and the Renewable Energy Zone from EnergyCo.