Buyers Agent Devonport for
Investment Property

268 house sales in a year, at 13 days on market. Devonport is the deepest-trading locality on the north-west coast. That depth is what you lean on when it is your turn to sell.

Book a Free Discovery Call

Devonport houses changed hands 268 times in the twelve months to 30 June 2026. The typical sale took 13 days. Add East Devonport, Miandetta and Spreyton and the four suburbs traded 397 houses. Turnover is what lets you exit when you choose to. It is also why Devonport is where we start on this coast.

Every property we assess is tested on tenant demand and on how much of the holding cost the rent covers. The last test is how fast it would sell again. Australian Property Experts works for investors only and takes nothing from developers or selling agents. The business was founded by Peter and Jody Ly, who own 18 investment properties. Peter has bought 300+ for clients across every state. If the south of the island is on your list too, our guide to the best suburbs to invest in Hobart sits alongside this one.
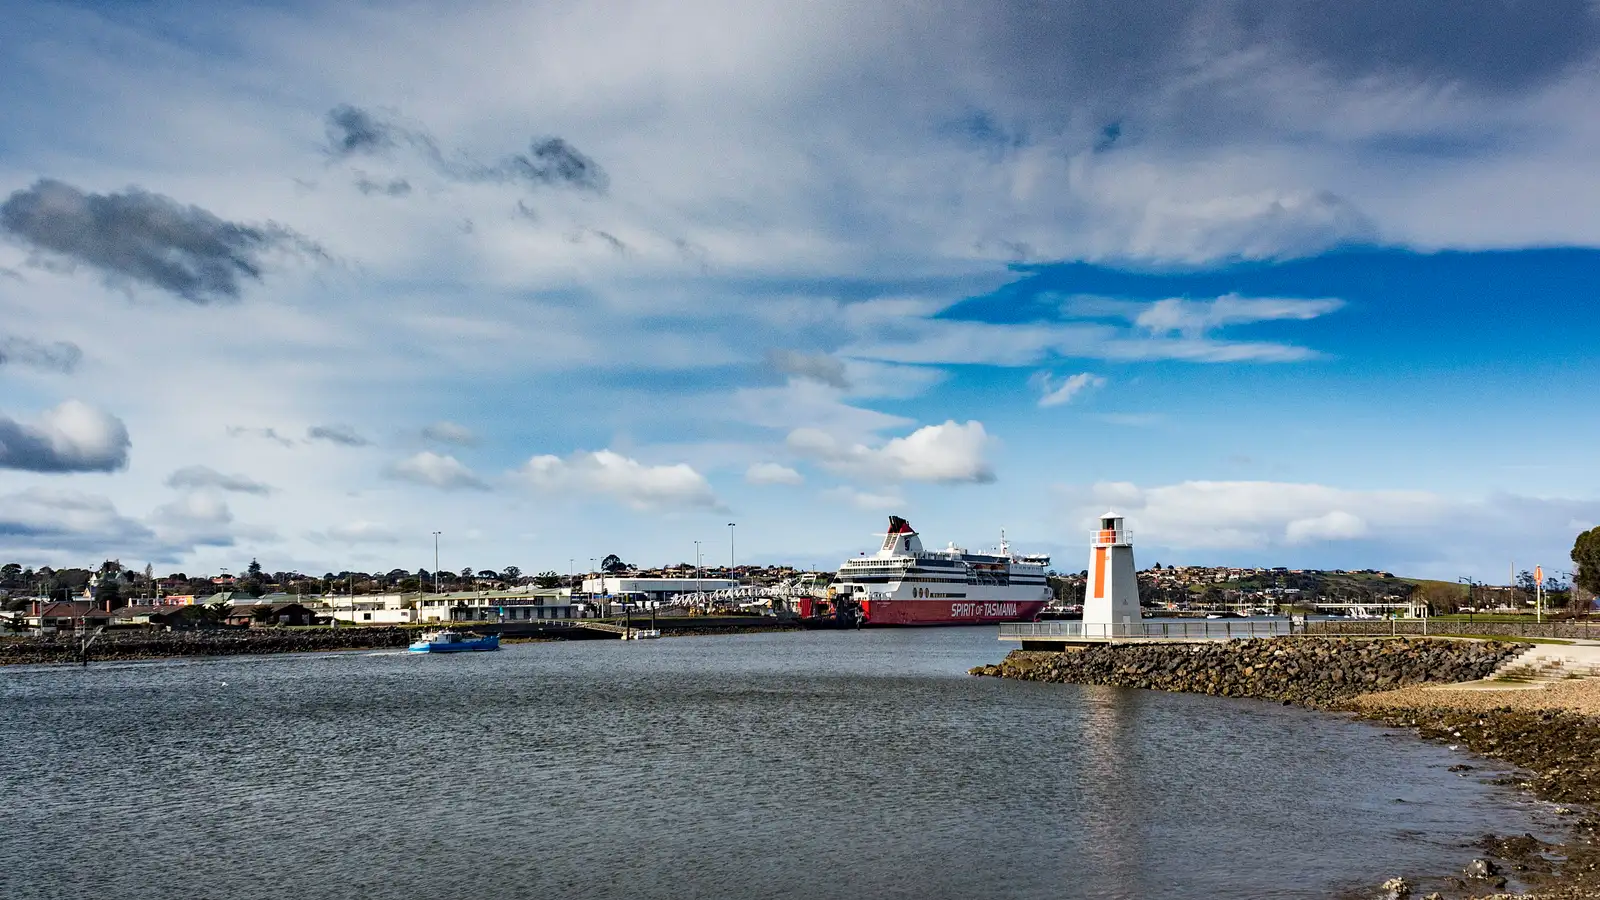
Mersey River at Devonport with a lighthouse, and a ferry at berth under a blue sky
The Mersey River at Devonport. Photo: Steven Penton from Bakers Beach, Tasmania Australia, CC BY 2.0, via Wikimedia Commons

Why Use a Devonport Buyers Agent?

Once you've settled on north-west Tasmania, the work is picking the market inside it that still has buyers when you want to sell. Devonport houses turned over 268 times in a year at 13 days on market. Ulverstone managed 109 sales at 34 days. Latrobe did 79 at 45, and Shearwater 39 at 48. We read volume and days on market before we read a median. Those two tell you whether the median means anything.

Five parts of the job that move the result on a Devonport purchase:

01

Sales Volume Before Median Price

268 house sales in twelve months is deep for the north-west. No single locality on the coast is busier. Plenty of surrounding pockets trade fewer than twenty times a year, which is too few sales to stand behind a median. Where volume is that thin, we price the property off the wider market rather than off its own median.

02

Houses and Units Have Split

Devonport houses rose 20.62% over the year. Units rose just 0.85%. They still pay more rent per dollar, 5.41% against 4.71%, so the income side is real. The capital side barely moved. We will not let a yield carry a purchase on its own.

03

Vacancy at 0.66%, Off Its May High

Postcode 7310 read 0.66% in August 2026. That is up from 0.51% in March but down from 0.83% in May. It works out to 23 vacant listings across 3,490 rental properties, tight on any measure. The rate has moved around this year. We pull the reading again before every offer.

04

The Lowest Entry Sells Slowest Here

East Devonport has the lowest median at $530,000 and grew 19.10%. The catch is time. It takes 30 days to sell, against 13 in Devonport proper. We show you that trade-off before you commit.

05

Nobody Pays Us But You

No developer, project marketer or selling agent sends money our way. Our only income comes from you.

Devonport Suburbs We Buy In

We track five house markets across Devonport and its immediate neighbours. Every yield below is weekly rent times 52 divided by the median price. That way the three numbers on each card agree. Published yields here draw the rent from a later date than the median, which lifts the return above what the property pays. Medians, growth, sales counts and days on market run to 30 June 2026. The rent figures are to 31 August 2026. If rent against growth is still your open question, our comparison of capital growth and rental yield works the trade through.

Bar chart of gross house yields: East Devonport 5.10%, Miandetta 4.98%, Devonport 4.71%, Latrobe 4.43%, Ulverstone 4.09% and Spreyton 4.02%.
East Devonport yields the most of the north-west coast suburbs shown. CoreLogic via YIP, yields calculated by us.

East Devonport - Lowest Entry Price

East Devonport carries the lowest median of the five suburb cards. Values grew 19.10% over the twelve months. Its average annual growth of 12.66% is the highest here.

  • Median house: $530,000
  • Gross yield: 5.10% at $520/wk
  • 12-month growth: +19.10%
  • Turnover: 68 sales at 30 days on market
  • Strategy: least capital in, paid for with the slowest exit of the Devonport suburbs

Devonport - The Liquid One

Nothing else on this page comes close on turnover. Behind the year just gone sits an average annual growth rate of 10.76%.

  • Median house: $585,000
  • Gross yield: 4.71% at $530/wk
  • 12-month growth: +20.62%
  • Turnover: 268 sales at 13 days on market
  • Strategy: the one most likely to have a buyer waiting

Miandetta - Smallest Sample

It had the softest growth year of the five. A typical sale took 17 days, but only 22 sales sit behind that median.

  • Median house: $595,000
  • Gross yield: 4.98% at $570/wk
  • 12-month growth: +6.54%
  • Turnover: 22 sales at 17 days on market
  • Strategy: a thin market, read with the sample in mind

Spreyton - Dearest, Weakest Yield

Spreyton carries the highest median of the five and the lowest computed yield. It does sell fastest, at 12 days.

  • Median house: $750,000
  • Gross yield: 4.02% at $580/wk
  • 12-month growth: +11.11%
  • Turnover: 39 sales at 12 days on market
  • Strategy: growth-led, with the rent doing the least work

Latrobe - Volume, Slower Sales

Latrobe has real volume in postcode 7307. On sales it sits behind Devonport and Ulverstone. A sale there takes 45 days, though, against Devonport's 13 days.

  • Median house: $645,000
  • Gross yield: 4.43% at $550/wk
  • 12-month growth: +14.67%
  • Turnover: 79 sales at 45 days on market
  • Strategy: real volume, without Devonport's speed

Devonport Units Compute 5.41%

Units pay the best rent per dollar here. They barely gained value over the year, so the income holds up while the capital side lags.

  • Median unit: $413,500 at $430/wk
  • Gross yield: 5.41% at $430/wk, before body corporate
  • 12-month growth: +0.85%, against +20.62% on houses
  • Turnover: 78 sales at 27 days on market
  • Longer run: 6.81% average annual growth against 10.76%

Reading Vacancy Across the North-West

These are postcode readings for August 2026, set against March 2026. Devonport, Burnie and Launceston all read higher than in March. All three still sit under 1%.

  • 7310 Devonport: 0.66%, up from 0.51% in March
  • Behind it: 23 vacancies across 3,490 rental properties
  • 7320 Burnie: 0.67%, up from 0.24%
  • 7250 Launceston: 0.75%, up from 0.73%
  • 7315 Ulverstone: 0.37%, but on only 5 listings, so a sample rather than a comparison

What We Pass On Here

We pass on anything priced off a locality median built on a handful of sales, wherever it sits on this coast. Units bought for the 5.41% alone are out too. Unit values rose 0.85% while houses rose 20.62%. Stock in the pockets that take 30 to 48 days to sell gets a no as well, unless the price pays you to wait.

We buy established investment properties only, chosen for tenant demand, turnover and what is left to grow. We do not buy off the plan or from project marketers.

Our Devonport Buyers Agency Process

Six steps, shaped by 300+ purchases. Budget does not change the process, and nor does the number of properties you already hold.

01

Free 15-Minute Call

We cover your goals, your budget, your timeline and how much risk you will carry. If Devonport is wrong for what you are trying to do, you will hear that on the call.

02

Strategy Session and Market Analysis

With the engagement signed, we work out your borrowing capacity, the ownership structure and what you want the property to do. Those get mapped across the north-west suburb by suburb. A $530,000 East Devonport purchase and a $750,000 Spreyton purchase are different plans.

03

Property Search (On and Off-Market)

We work the public listings and our off-market network across Devonport, Latrobe and the coast. Two to four weeks is what most briefs take to surface three to five serious candidates.

04

Due Diligence and Property Reports

Every shortlisted property goes through building and pest inspections, comparable sales analysis, and rental appraisals. We also count how many sales the comparables rest on. Twenty-two trades a year and 268 do not support the same confidence. You will know which one you are reading.

05

Negotiation and Offer

The negotiation is ours to run. Thirteen days on market means vendors here expect a fast answer. We work with that pace, not against it.

06

Contract to Settlement

Once the contract is signed, we hold the dates together across your solicitor, your broker and your property manager. That runs all the way to keys and a signed lease.

Allow 6-12 weeks from engagement to settlement on most purchases. Finance approval and the wait for the right property set the pace.

Who Uses Our Devonport Service?

Buyers Who Want an Exit

You care as much about selling well as buying well. Devonport houses turn over 268 times a year at 13 days. On the way out, that is the figure that matters.

Time-Poor Professionals

Your income is strong and your calendar is not. The search, the inspections and the negotiation sit with us, and you get your weekends back.

Yield-Focused Investors

You want the rent carrying more of the holding cost. Devonport units compute 5.41% and East Devonport houses 5.10%, and we will show you what sits behind each.

Interstate Investors

Buying in Tasmania from the mainland means trusting somebody else's eyes. Our guide to buying interstate sets out what changes when you cannot walk through it yourself.

SMSF and Trust Buyers

A Self-Managed Super Fund or family trust purchase has to be set up before the contract is signed. We sequence the bare trust against the contract dates, alongside specialist SMSF lawyers. Since 10 August 2026 an SMSF can no longer borrow to buy residential property, so a fund purchase now has to come from the balance you already hold.

First-Time Investors

This is your first purchase. The gap between a 13-day market and a 45-day one never shows on a listing. You will see what we ruled out and why.

Meet Peter Ly

Co-Founder & Principal Buyers Agent

Before founding Australian Property Experts, Peter built his career in accounting, banking and finance, where he learned to check a figure instead of repeating it.

18 investment properties, spread across several states
300+ purchases completed for clients around Australia
A career in accounting, banking and finance before the business started
Paid by you alone, never by a developer or a selling agent

Peter does not recommend a property he would decline for his own portfolio. He holds houses, townhouses and units in several states. He knows these holding costs first-hand.

Peter's View on Devonport in 2026

Peter's view is that Devonport earns its place on turnover rather than on price. 268 house sales at 13 days is the deepest trading of any locality in the north-west. Across Devonport, East Devonport, Miandetta and Spreyton the count is 397. That depth is what the slightly higher entry price buys you here.

His caution is the house and unit split. Houses rose 20.62% over the year while units rose 0.85%. Yet units are where the stronger 5.41% yield sits. Vacancy in postcode 7310 also moved from 0.51% in March to 0.66% in August, still very tight but higher than it started the year. The growth figures on this page stop at 30 June 2026.

Our base is Sydney, and we buy across the country. A Devonport purchase is handled remotely. Inspections are done on the ground and we run the contract through to settlement.

Peter Ly - Devonport Buyers Agent

Buyers Agent Devonport Fees

One flat fee, agreed before we start. It is set by the scope of the purchase rather than by the price you pay. Nothing on a Devonport purchase is charged as a percentage. No developer or selling agent pays us a commission either. The fee covers the strategy session, the search across on-market and off-market stock, inspections attended for you, full due diligence coordination, negotiation and settlement coordination.

Sitting outside the fee are the third-party costs, mainly the building and pest inspection, your solicitor and your mortgage broker. Many buyers agents still price as a percentage of what you pay. Our guide to what a buyers agent costs puts the difference in dollars.

Standard Investment Property

Strategy session, search across on-market and off-market stock, due diligence, negotiation and settlement coordination for a single residential purchase in Devonport or the north-west coast.

Complex Purchases

SMSF purchases, family trusts, company structures, or a site needing subdivision or development analysis. Those carry a great deal more due diligence, and the fee accounts for it.

Portfolio Purchases

Two to five or more purchases across Tasmania or nationally attract volume pricing, and we sequence them so each settlement sets up the next.

What's included in our fee

  • Personalised strategy session
  • Suburb and postcode-level market analysis
  • Off-market search across Devonport and the north-west coast
  • Inspections attended for you
  • Building and pest inspections booked and reviewed
  • Full due diligence coordination
  • Rental appraisal and cash flow modelling
  • Negotiation and offer management
  • Contract review coordination
  • Settlement support and a property manager introduction

Not included

  • Building and pest inspection fees, billed to you directly
  • Solicitor and conveyancing fees, billed to you directly
  • Mortgage broker fees, invoiced to you by the broker

A percentage fee rises with your purchase price. That means your agent earns more when you pay more, which a fixed fee avoids. Our case studies set out what clients have bought.

Devonport vs the Other Markets

Launceston and Burnie are the two obvious alternatives to Devonport in the north, and the lists below set out both sides.

Where Devonport Wins

  • Turnover you can rely on: 268 house sales at 13 days on market, the busiest locality on the north-west coast
  • Growth with volume behind it: houses up 20.62% on those 268 sales, and 10.76% average annual growth
  • Entry from $530,000: East Devonport is the lowest median and grew 19.10%
  • Vacancy at 0.66%: 23 vacant listings across 3,490 rental properties in postcode 7310, August 2026
  • Yield with the capital side behind it: 4.71% computed on Devonport houses, on values that rose 20.62% over the year

What to Weigh Up

  • Units rose just 0.85% over the year: houses rose 20.62% in the same period, so the stronger 5.41% unit yield is not backed by the capital side
  • Vacancy is higher than in March: postcode 7310 went from 0.51% in March 2026 to 0.66% in August, after peaking at 0.83% in May
  • This is a small market: 268 house sales a year is deep for the north-west, and thin next to any capital
  • Growth figures stop at 30 June 2026: Cotality has national values 5.2% below their March 2026 peak at 30 September, and regional Tasmania 0.1% below its August 2026 peak, so the cards do not capture the turn
  • The north-west is not uniform: Cotality has the Burnie-Ulverstone region up 14.0% over the year against Devonport's 10.7%, so the market 50km west has been running harder
  • East Devonport takes 30 days to sell: against 13 in Devonport proper, so the lowest entry price is the slowest of the Devonport suburbs to exit
  • Spreyton computes 4.02%: the weakest yield of the five suburb cards sits on the dearest median at $750,000
  • Tasmania is across Bass Strait: if you live on the mainland, you will not be inspecting these yourself

How Devonport Compares

  • vs Burnie ($580,215 regional median, up 14.0%): lower-priced and growing faster on Cotality's index to 30 September 2026, but slower to exit, with 27 of postcode 7320's 142 listings sitting over 180 days in August 2026
  • vs Launceston ($769,500 median, 4.05% computed): that is the inner Launceston locality on 56 sales at 26 days; Cotality puts the wider Launceston region at $676,218, up 13.5%, against Devonport's $616,739, up 10.7%
  • vs Ulverstone ($610,000 median, 4.09% computed): up 12.96% on 109 sales at 34 days, the closest thing to a second liquid market here
  • vs Shearwater ($732,500 median, 3.98% computed): down 1.68% on 39 sales at 48 days, the slowest seller of the group
  • vs the rest of Tasmania: we also buy in Hobart, and our Launceston market update covers the north

How We Handle Devonport Numbers

We calculate every yield here ourselves, as weekly rent times 52 divided by the median price. Ours come out lower than the published figures. They also reconcile against the median and rent beside them.

Volume comes before growth when we read a suburb. Miandetta grew 6.54% on 22 sales. That does not carry the weight of Devonport's 268 or Ulverstone's 109. Any locality trading under twenty times a year gets priced off the wider market instead.

What We've Bought
for Clients

Purchases we made for clients, each valued after a year or more. None are in Tasmania, so each is labelled with its state.

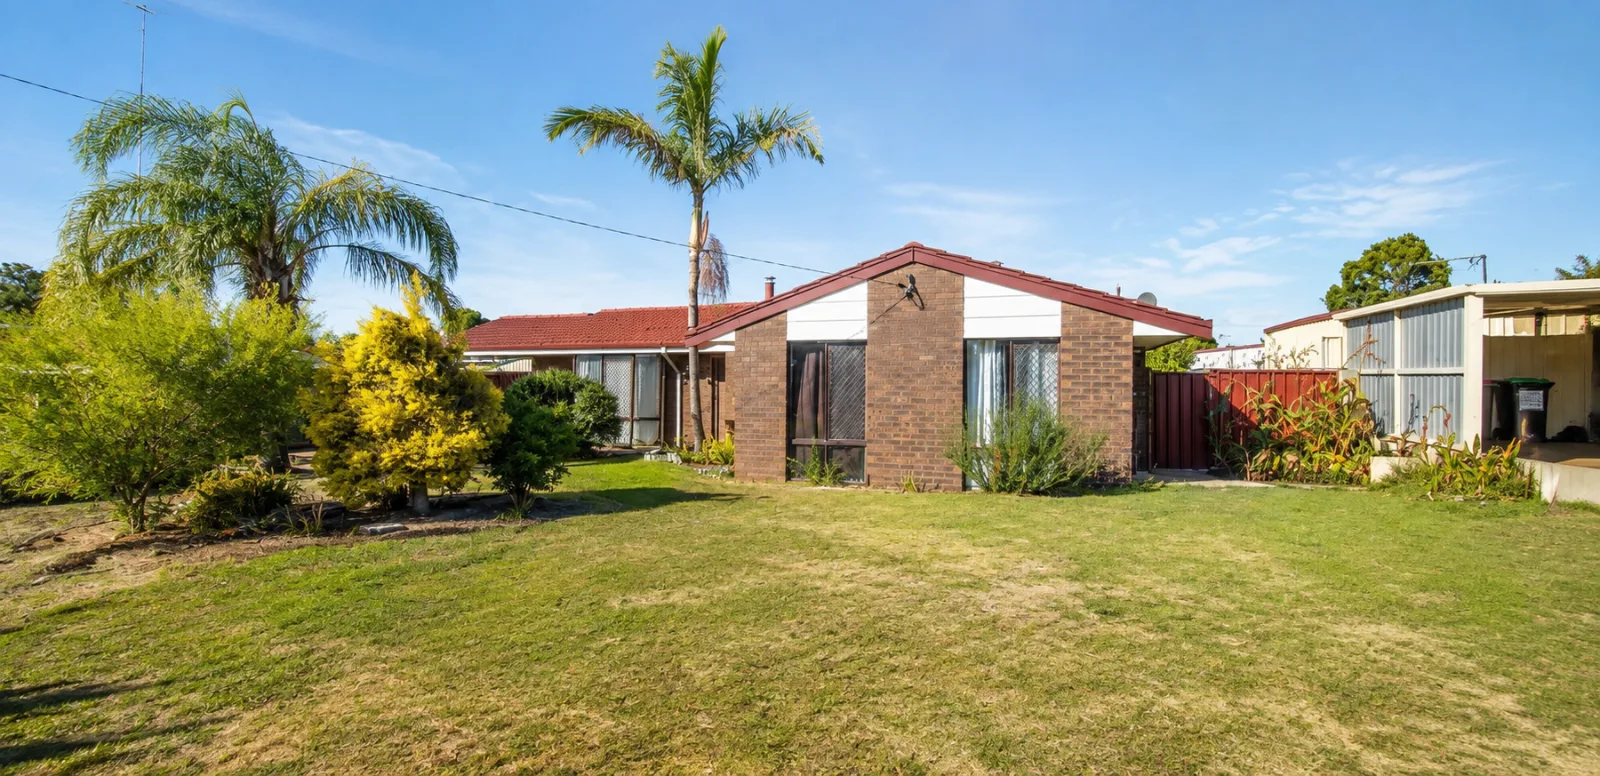
Investment property in Western Australia
94.4% growth in 33 months (WA)

4 bed 1 bath double-brick house bought under market value for $355,000. Valued at $690,000+ in March 2026. Rented at $630/wk. Settled June 2023.

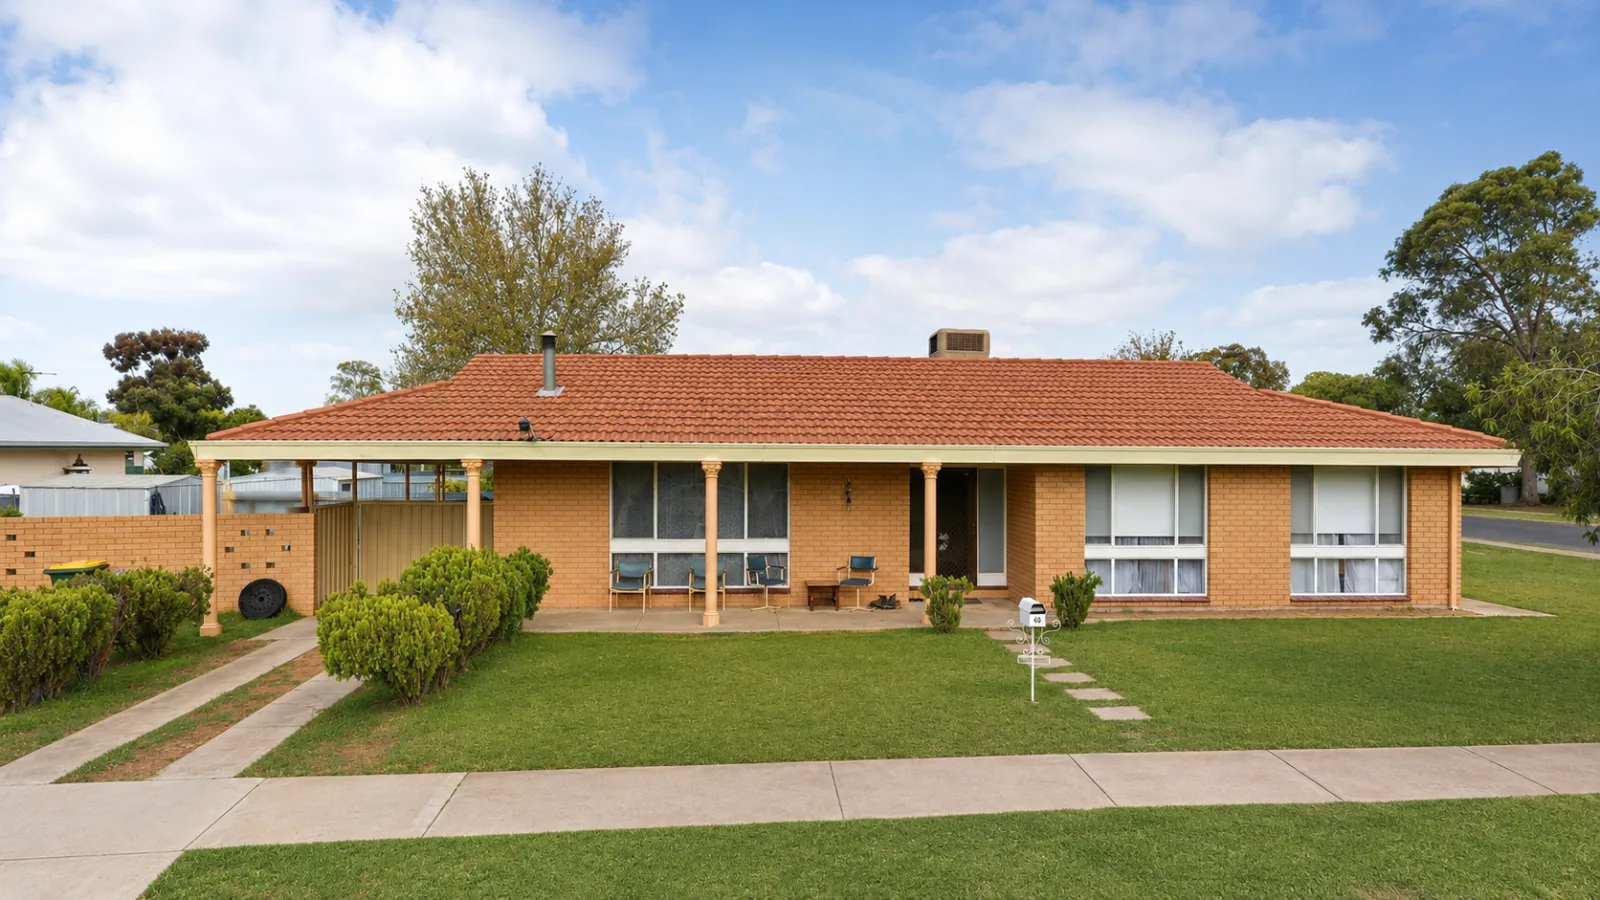
Investment property in Victoria
50.7% growth in 12 months (VIC)

Victorian property purchased for $345,000. It settled in March 2025 and was valued at $520,000+ in March 2026. That's $175,000 of equity in 12 months.

Past performance is not a guarantee of future results. Property values can go down as well as up.

View All Case Studies

Not certain the north-west is the right call? We work as an investment property buyers agent in every Australian state. The shortlist is built from figures rather than the town you like the sound of. Weighing up Tasmania as a whole? Our Tasmania buyers agent page compares Devonport with Hobart, Launceston and Burnie. The pricing sits in our buyers agent fees guide.

Helpful Resources

Buyers Agent Tasmania
Tasmania's main markets compared.
Investment Buyers Agent
How we work.
Buyers Agent Fees
Industry pricing.
Off-Market Properties
How investors reach them.
Investment Calculators
17 free tools.
SMSF Property
Buying through super.

Book Your Free
Discovery Call

A 15 minute call to understand your goals, your budget, and whether Devonport is the right market for what you're trying to build.

Frequently Asked Questions

What is a buyers agent? +

A buyers agent is licensed to search for, assess and negotiate property on behalf of the buyer rather than the seller. The selling agent works for the owner and is paid to push the price up. A buyers agent works for you and is paid to bring it down, so both sides of the table have someone qualified.

What does a buyers agent do in Devonport? +

A buyers agent picks the market, shortlists the property, runs the due diligence, negotiates the price and holds the purchase together to settlement. In Devonport the market call carries most of the result. Devonport houses recorded 268 sales at 13 days on market over the twelve months to 30 June 2026, the deepest single locality on the north-west coast. With East Devonport, Miandetta and Spreyton, the four suburbs traded 397 houses. Getting the suburb right inside that market is where most of the outcome sits.

How long does it take to buy an investment property? +

Six to twelve weeks from engagement to settlement is the usual range. On a Devonport brief the search takes two to four weeks in most cases. Finance approval and the settlement period fill out the rest of that range. An off-market property that already matches your brief can pull that in, and an SMSF purchase will push it out.

How much does a buyers agent cost in Devonport? +

We charge one flat fee, agreed before any work starts and set by the scope of the purchase rather than by the price you pay. Nothing is charged as a percentage, so a dearer property earns us no more. Nor does any developer, project marketer or selling agent pay us anything. That fee covers the strategy session, the search across on-market and off-market stock, inspections attended for you, full due diligence coordination, negotiation and settlement coordination. Outside it sit the third-party costs, mainly the building and pest inspection, your solicitor and your mortgage broker. Most of the industry still charges a percentage. On a $750,000 Spreyton house, that produces a much bigger number than a fixed fee does.

Which Devonport suburb should I buy in? +

It comes down to whether you want the lowest entry price or the fastest exit. East Devonport has the lowest median at $530,000, grew 19.10%, computes 5.10% and takes 30 days to sell. Devonport itself sits at $585,000 and 4.71%. It sells in 13 days on 268 sales a year. Spreyton is the dearest at $750,000 and the weakest on yield at 4.02%, though it sells fastest at 12 days on 39 sales. Miandetta at $595,000 computes 4.98%, but on only 22 sales. Latrobe at $645,000 computes 4.43% on 79 sales at 45 days. Units compute 5.41% at a $413,500 median. Every yield here is weekly rent times 52 divided by the median price, with medians and growth to 30 June 2026 and rents to 31 August 2026.

Data sources: medians, 12-month growth, average annual growth, sales counts and days on market are CoreLogic figures to 30 June 2026 via Your Investment Property. Weekly rents are to 31 August 2026. Every yield here is calculated by us as weekly rent times 52 divided by the median price, so it reconciles with the median and rent beside it. Vacancy rates are SQM Research readings at postcode level for August 2026, against March 2026. Regional medians for Devonport, Burnie - Ulverstone and Launceston are Cotality's Home Value Index to 30 September 2026. Client results come from our published case studies.

Book a Free Discovery Call