The suburb you pick matters more than the property you buy. Plenty of investors skip the data when they research suburbs for investment property. They buy where they live, follow a hotspot list, or take a selling agent’s word for it.
This is the 12-point scorecard we run on every suburb before shortlisting it. Each point has a specific threshold, a free data source, and a reason it matters. No gut feel required.
Why Most Suburb Picks Fail
The beginners guide covers how many investors sell early and why. A common reason is buying in the wrong location, which usually means the wrong suburb rather than the wrong property.
A suburb that “feels right” can still have rising vacancy, stalled population growth, and a supply pipeline that will crush rents within three years. You can’t see any of that from the street. You can see all of it in the data.
The other common failure is buying based on last year’s hotspot list. By the time a suburb makes a top-ten list, the easy growth is already priced in. Real suburb research means finding the fundamentals before the crowd arrives.
The 12 Data Points That Matter
These are the metrics that separate a good suburb from a bad one. Each has a threshold. A suburb needs to clear most of them to make a shortlist.
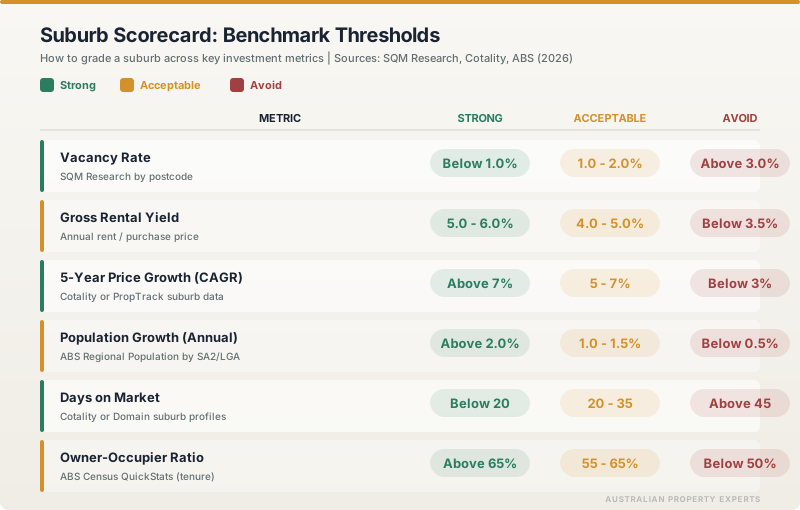
1. Population growth. More people means more housing demand. Check the ABS Regional Population release at the SA2 or LGA level. In 2024-25, Perth’s population grew at 2.4%, Brisbane at 2.1%, and Melbourne at 2.0%. A suburb or region growing above 1.5% annually is tracking well. Below 0.5% and demand is flat.
2. Vacancy rate. This tells you how hard it is to find a tenant. SQM Research publishes free vacancy data by postcode. In August 2026, SQM’s national rate sat at 1.3%. Perth was at 0.6%, Adelaide at 0.6% and Brisbane at 0.9%. Below 2% is strong. Below 1% is very tight. Above 3% and rents will come under pressure.
3. Median price and 5-year growth. You need historical performance, not forecasts. Cotality and PropTrack both publish suburb-level medians and growth rates. Look for suburbs that have delivered 5-8% compound annual growth over five years. Anything above 10% sustained may mean the run is already priced in. Below 3% and you are treading water after inflation.
4. Gross rental yield. Annual rent divided by purchase price. You need this to hold the property. Suburbs yielding 4-6% gross on established houses are in the sweet spot for investors in 2026. Below 3.5% and holding costs bite hard. Above 7% and you should ask why, because the answer is usually weak growth or high risk. For how growth and yield work together in a portfolio, see capital growth vs rental yield.
5. Days on market. How long properties take to sell. Cotality publishes this at suburb level. Cotality’s August 2026 chart pack puts the national median at 35 days to sell, over the three months to July. A suburb where days on market is rising is cooling. Where it is falling, demand is building. Compare the current figure to the suburb’s own 12-month average.
6. Vendor discount. The gap between listing price and sale price. When vendors accept bigger discounts, buyer power is increasing. When discounts shrink or go negative, the market is tight. A rising vendor discount in a suburb can signal the start of a downturn before the median price moves.
7. Supply pipeline. Check the ABS Building Approvals data for the LGA. Nationally, the ABS counted 17,687 dwellings approved in July 2026, seasonally adjusted. That is about 212,000 a year, short of the 240,000 a year the Housing Accord needs. But this varies wildly by suburb. A greenfield corridor with 2,000 lots approved absorbs demand very differently to an established suburb with heritage overlays. Our rule of thumb: if annual approvals exceed 3% of the suburb’s existing stock, it is building faster than demand can absorb. For the full maths on how supply affects prices, see land supply and property growth.
8. Infrastructure spending. New transport, hospitals, and employment hubs lift demand and reprice suburbs within their catchment. The federal government is paying the states $13.5 billion for infrastructure in 2026-27, including $11.9 billion through the Infrastructure Investment Program. But the suburb-level question is always the same. What is being built within 5-10km of this postcode, and when does it finish? State budget papers and Infrastructure Australia’s priority list are the primary sources.
9. Employment diversity. Single-employer or single-industry towns are fragile. When the mine closes or the plant shuts down, property values follow. Look for suburbs with employment spread across healthcare, education, government, retail, and professional services. The ABS Census data and .id community profiles show employment by industry at the LGA and suburb level.
10. Owner-occupier ratio. A suburb with more than 40% rentals can be volatile. Owner-occupiers provide price stability because they hold through downturns instead of panic-selling. Check the ABS Census for tenure type. A mix of 60-70% owner-occupier and 30-40% renter is healthy for investors. Below 60% owner-occupier and the suburb may be over-invested.
11. Block size and zoning. This is where value-add potential lives. A 600sqm block in a zone that permits a second dwelling gives you options: granny flat, subdivision, or cosmetic reno to force equity. Check the local council’s planning scheme for minimum lot sizes and permissible uses. For investors who want to build cash flow with a granny flat, this data point filters out most properties before you look at a single listing.
12. Hazard overlays. Flood zones, bushfire-prone areas, contamination sites, and mine subsidence zones all affect insurance costs, lending, and resale. Every state council publishes overlay maps online. Check before you shortlist, not after you have made an offer. A property in a flood zone can carry a much higher premium or a separate flood excess, and some lenders will not touch it.
Where to Pull the Data for Free
You do not need a paid subscription to run this analysis. Every data point above has a free source.
| Data point | Free source |
|---|---|
| Population growth | ABS Regional Population (abs.gov.au) |
| Vacancy rate | SQM Research (sqmresearch.com.au) |
| Median price and growth | Cotality’s propertyvalue.com.au, PropTrack |
| Rental yield | Median rent / median price (Domain, realestate.com.au) |
| Days on market | Domain, realestate.com.au suburb profiles |
| Vendor discount | Cotality data via propertyvalue.com.au |
| Supply pipeline | ABS Building Approvals by LGA |
| Infrastructure | State budget papers, Infrastructure Australia |
| Employment diversity | ABS Census, .id community profiles |
| Owner-occupier ratio | ABS Census QuickStats (tenure type) |
| Block size and zoning | Local council planning maps |
| Hazard overlays | State planning portals (e.g. NSW ePlanning, QLD Globe) |
The bottleneck is time, not access. Pulling this data for one suburb takes 2-3 hours. For a shortlist of 10 suburbs across three states, you are looking at 20-30 hours of research before you have inspected a single property.
How to Score and Compare Suburbs
Once you have the data, score each suburb out of 12. One point for each metric that hits the threshold.
10-12: Strong candidate. Move to property-level research.
7-9: Worth investigating further. Check which metrics are weak and whether that weakness is structural or temporary.
4-6: Marginal. The numbers say this suburb needs something specific to change before it works.
Below 4: Walk away. The fundamentals are not there.
No suburb scores a perfect 12. What you are looking for is a cluster of strong scores on the metrics that matter most for your strategy. If you are buying for yield, vacancy rate and rental yield carry more weight. If you are buying for growth, population growth, supply constraints, and infrastructure carry more.
The investors who build portfolios across multiple states run this scorecard on 20-50 suburbs before narrowing to 3-5. If you are buying interstate, this framework replaces the local knowledge you do not have with data you can verify from anywhere.
When the Numbers Say Walk Away
Some signals should end your interest in a suburb immediately.
Vacancy above 4%. Tenants have too many options. For how this plays out across four towns at similar prices, see our Central West NSW comparison. Rents will soften, and your yield projection becomes fiction.
Population declining or flat. No demand growth means no price growth. Infrastructure alone will not save a suburb that is losing people.
Dwelling approvals spiking in a greenfield corridor. New supply competes directly with your established property for tenants and buyers. By our 3% rule of thumb above, a corridor approving that much new stock every year will outbuild its own demand.
Single-industry employment. If more than 30% of local employment sits in one sector, a downturn in that sector takes the suburb with it.
Flood or bushfire overlay with no mitigation. The insurance cost alone can turn a positive cash flow property negative. The resale pool also shrinks because some buyers and lenders will not participate.
When a suburb fails on any of these, the least costly response is to move on. There are over 15,000 suburbs in Australia. You only need one good one per purchase.
Run the Scorecard Before You Shortlist
Hotspot lists sell magazines and generate clicks. They tell you where everyone is already looking, which is usually the worst time to arrive. A suburb scorecard built on current data tells you where the fundamentals are strong and the crowd has not priced it in yet. That gap between “the data says yes” and “the market knows” is where investors build their edge.
The framework works whether you are evaluating affordable corridors or blue-chip suburbs. The metrics do not change. The thresholds shift with your strategy, your budget, and your risk tolerance.
This is general information only and not financial advice. Speak to a qualified professional before making investment decisions.
If you want help applying this scorecard to your next purchase, book a free call.
Sources
- Regional population, 2024-25, Australian Bureau of Statistics
- Residential vacancy rates, SQM Research
- Monthly Housing Chart Pack, August 2026, Cotality
- Building approvals, Australia, July 2026, Australian Bureau of Statistics
- Housing Accord progress, National Housing Supply and Affordability Council
- Federal Budget Paper No. 3, 2026-27: payments for infrastructure
- Suburbs and localities, ABS Australian Statistical Geography Standard
- Flood insurance, Canstar


.jpg)