“There’s endless land out there. They can just keep building. How can prices ever grow?” Investors ask us this about growth-corridor suburbs all the time. On the surface it makes sense. But the same worry was raised about some of the best-performing suburbs of the past decade. So let’s test it against the data.
The oversupply argument
The argument goes like this. Prices come down to supply and demand. A suburb surrounded by paddocks zoned for housing has effectively unlimited supply, and that should cap capital growth. Sydney’s eastern suburbs can’t make more land. Melton can. So the usual rule is to buy scarcity and avoid abundance.
One property commentary site said exactly this about Melton South in June 2024. Developers were selling house-and-land packages everywhere, the “influx of houses will cause an oversupply”, and prices would stagnate or fall. As they put it: “Supply is the enemy of Capital Growth!”
In the 12 months to June 2026, Melton South houses grew 10.7% and neighbouring Melton grew 16.5% (YIP).
When oversupply fears were right
The sceptics have been right before, when new supply landed just as demand fell away.
Ellenbrook, on Perth’s north-eastern fringe, was the textbook case. Through the mid 2010s it was exactly what the sceptics describe: estate after estate releasing lots into a market where demand had collapsed with the mining downturn. Perth’s median house price fell from around $560,000 in 2015 to around $480,000 in 2017. Analysts later named Ellenbrook as a suburb hit hard by oversupply in that period.
So yes, when new lots hit the market faster than new households form, and you paid at or above the cost of building new, supply hurts you.
What five estate suburbs flagged for oversupply did next
Those same suburbs look like this today. Every one of them carried the “endless land” tag at some point in the last decade.
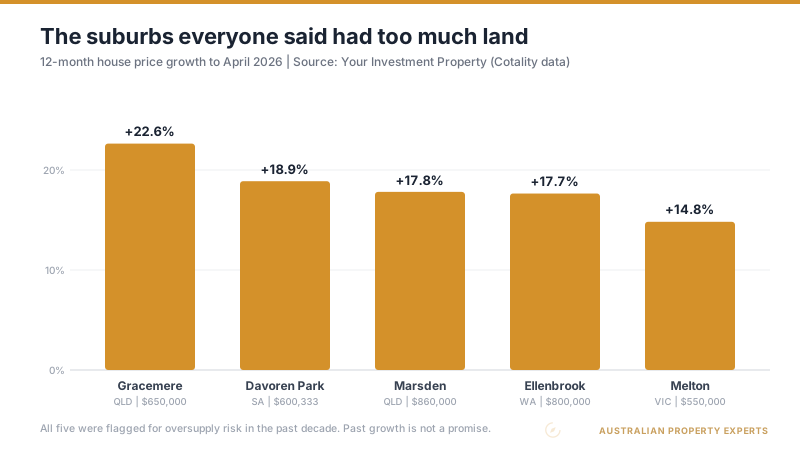
Gracemere, the flat-land estate suburb outside Rockhampton: up 21.8% in the 12 months to June 2026 on a $670,000 median (YIP). Ellenbrook itself, the oversupply poster child: up 19.4% to an $825,000 median (YIP), with REIWA showing $850,000 over the year to August. Marsden in Logan: up 18.6% (YIP). Melton: up 16.5% (YIP). Davoren Park was written off for decades as one of Adelaide’s lowest-priced corners, then hit again when Holden’s Elizabeth plant closed in 2017. It is up 15.1% (YIP).
Then there’s the rental side, where oversupply would show first. In August 2026, vacancy sat at 0.57% in Marsden’s postcode, 0.89% in Ellenbrook’s and 0.92% in Davoren Park’s (SQM Research). Gracemere’s was 1.13%, while Perth and Adelaide ran at 0.61% and 0.64% city-wide. Four of the five are near or under 1%, which is not what drowning in supply looks like. Melton is the exception at 2.68%, above the 1.5% line we use below.
Past growth is not a promise about next year. What these five show is that lots of land nearby did not cap their prices, because the cost of building new kept rising.
Buying below replacement cost
The land supply argument misses a mechanism. In a corridor where new stock is constantly being built, the price of new stock becomes the ceiling every buyer compares against. That price has three parts: land, construction, and the developer’s margin. All three have gone one way.
Building materials are 38.2% more expensive than in 2019, according to Master Builders Australia in July 2026. The median greenfield lot across the capitals is up 43% in five years (UDIA State of the Land 2026). Adelaide lots rose 23% and south-east Queensland lots 17% in 2025 alone.
Put lot and build together and compare it with what established houses in the same corridors actually trade for:
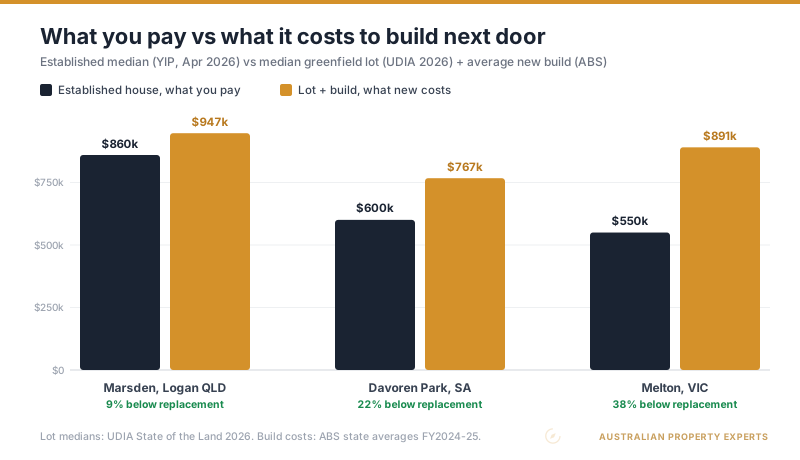
A median lot in south-east Queensland ($488,360) plus the average new Queensland house approval ($530,040) is roughly $1.02 million. That is before landscaping, fencing or a developer’s margin. Marsden’s established median is $880,000. In northern Adelaide the gap is wider, at roughly $816,000 to replace and $610,000 to buy established. In Melton the established median is around 40% below what land-plus-build costs across Greater Melbourne. Build costs are still climbing, too. The national average new house approval rose from $492,426 in 2024-25 to $520,535 in the 12 months to July 2026 (ABS Building Approvals).
That gap protects you, because a builder can’t undercut an established house when building new costs more than you paid. Every quarter construction costs rise, the floor under an established house bought below replacement cost rises with it. This is why we buy established houses in these corridors and never the house-and-land packages being built around them: the new stock is the expensive version of the same suburb.
In Perth, though, the same maths shows the gap has almost closed. Ellenbrook’s $825,000 median now sits only about 3.5% below a Perth lot plus build, roughly $855,000. If prices there keep rising faster than build costs, that discount will be gone.
Zoned land is not supply
The other half of the answer is that the paddocks on the zoning map are not actually competing with you. Zoned land converts into titled, buildable lots at a crawl.
The UDIA’s 2026 State of the Land report quantifies the drip-feed. Since 2008, an average of 52 new estates entered the market each quarter, averaging 339 lots each. In the past year that fell to 42 estates per quarter, averaging just 145 lots. South-east Queensland finished 2025 with 0.4 months of lot stock against an ideal band of two to four months. The UDIA calls that critically undersupplied. Perth held 0.55 months. The report puts that down to supply-side constraints, such as drawn-out infrastructure agreements with councils.
Nationally, the story is the same. The Housing Accord needs roughly 60,000 completions a quarter to hit 1.2 million homes by mid 2029. The first seven quarters delivered 308,000, about 44,000 a quarter (National Housing Supply and Affordability Council, August 2026). Australia is not out-building demand anywhere, least of all in the corridors absorbing the population growth.
The mental image behind the objection is bulldozers releasing unlimited houses next door. In practice, new lots reach the market more slowly than new households form, so the land nearby turns into competing houses gradually.
High density is the case where this logic inverts, because a rezoning creates dwellings that land never could. We worked that through on a market that had ten years of it in Parramatta apartments: ten years, no capital growth.
How we vet a growth corridor
The land supply question is still worth asking on every purchase. It just has better tests than “are there paddocks nearby”:
- Price against replacement. Established purchase price versus current lot-plus-build in the same corridor. Below it, new stock protects you. At or above it, you need the other tests to be emphatic.
- Vacancy under about 1.5%. Oversupply shows up in rents first. In Ipswich, the postcode taking in the Ripley estates had 1.19% vacancy in August 2026, against 0.62% around the established suburbs near the CBD, as our Ipswich suburb guide shows. Sub-1% vacancy and rising rents are the opposite signal.
- Lot pipeline versus demand. Months of lot stock, estate sizes, and infrastructure sequencing, not zoning maps. The UDIA publishes this annually.
- Timing in the cycle. In 2015 Ellenbrook’s new supply landed just as demand collapsed. By 2023 the same suburb had more demand than supply.
This is the analysis behind every corridor we buy in. You can see the results on real client purchases. The suburbs above are examples of the mechanism, not a buy list. Which corridor fits depends on your budget, the cycle and what the data says the day you’re buying.
What actually protects your price
When a client asks about land supply, we ask “what stops this suburb being undercut?” The answer comes down to arithmetic. You want established stock bought below the cost of building its replacement, in a corridor where lots title slower than households form and vacancy is tight. What protects your price is the cost of delivering a competing house, and that cost keeps going up.
Sources
- Ellenbrook suburb profile - Your Investment Property
- Davoren Park suburb profile - Your Investment Property
- Marsden suburb profile - Your Investment Property
- Gracemere suburb profile - Your Investment Property
- Melton suburb profile - Your Investment Property
- Melton South suburb profile - Your Investment Property
- Ellenbrook profile - REIWA
- UDIA State of the Land 2026
- Home building costs rise, but not as much as feared - CommBank Newsroom
- Perth’s past two decades of price movements - API Magazine
- Residential vacancy rates - SQM Research
- Quarterly Report August 2026 - National Housing Supply and Affordability Council
- Building Approvals, Australia - ABS
This is general information only and not financial advice. Market data reflects the sources and dates cited and can change. Past performance is not an indicator of future results. Speak to a qualified professional before making investment decisions.
See how we pick the corridors worth buying in.
If you want the replacement-cost and supply numbers run on a suburb you’re considering, book a free discovery call.