A unit in Melbourne’s Prahran costs $500,000 and rents for $595 a week. That is a 6.19% gross yield in a suburb where the median house is $1,600,000.
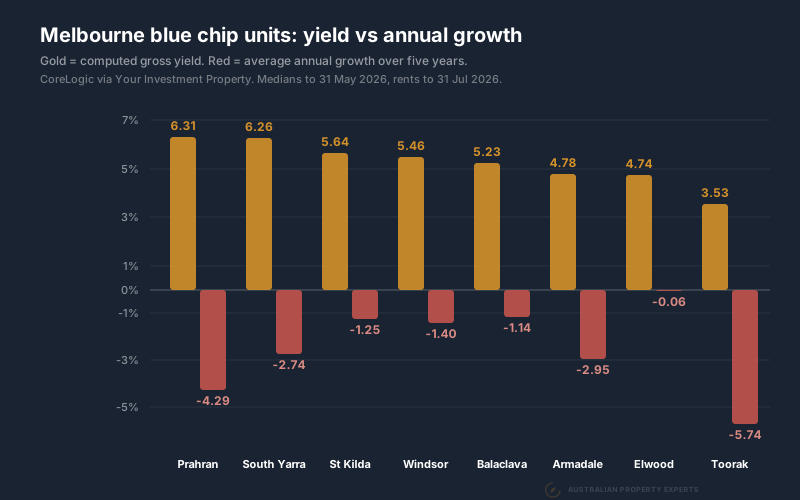
Melbourne blue chip units look like the best of both worlds on that arithmetic. We ran the five year total return on eight of them, and the price falls mattered far more than the yield.
What Melbourne blue chip units yield
These are the eight markets investors ask us about most, all computed the same way: weekly rent times 52, divided by the median.
| Suburb | Unit median | Rent | Computed yield | 5yr average |
|---|---|---|---|---|
| Prahran | $500,000 | $595 | 6.19% | -3.90% a year |
| South Yarra | $525,000 | $625 | 6.19% | -2.80% a year |
| St Kilda | $512,000 | $550 | 5.59% | -1.42% a year |
| Windsor | $530,000 | $550 | 5.40% | -0.74% a year |
| Balaclava | $591,500 | $578 | 5.08% | -1.06% a year |
| Elwood | $647,000 | $600 | 4.82% | -0.29% a year |
| Armadale | $701,000 | $625 | 4.64% | -2.58% a year |
| Toorak | $970,000 | $700 | 3.75% | -6.40% a year |
The yields are real. Outer Melbourne houses pay less: St Albans computes to 3.56%, Melton to 3.77% and Doveton to 4.13%. Prahran at 6.19% beats all three. The right hand column is the problem. Every one of the eight has a negative five year average.
The price gap is the whole pitch
The argument for these markets writes itself. A house in Toorak is $4,960,000 and a unit is $970,000, so the unit is a fifth of the price in the same postcode. South Yarra runs $1,875,000 against $525,000, a little over a quarter. Prahran is $1,600,000 against $500,000, a little under a third.
Buy the good postcode at a fraction of the price, collect a yield the outer suburbs cannot match, and let the address do the rest.
It’s a reasonable theory, but it hasn’t worked for five years. Across these eight, the wider the gap, the worse the units did.
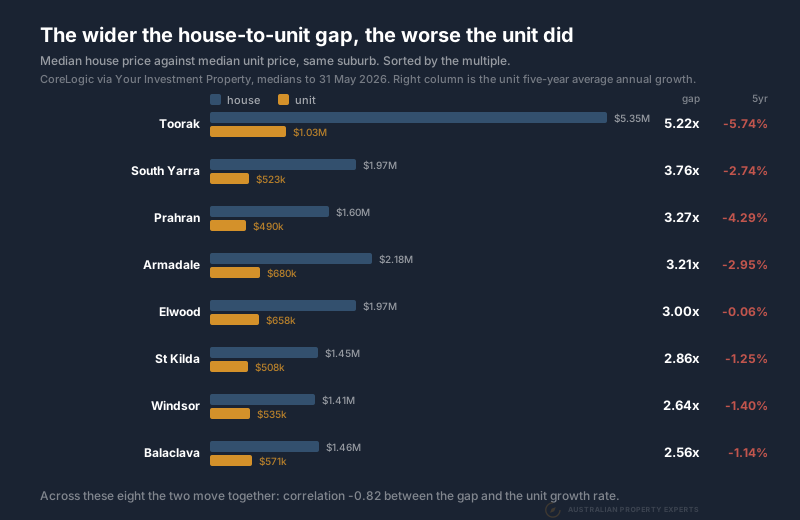
Sort the eight by that multiple and the growth column sorts itself. Toorak has the widest gap at 5.11 times and the worst five year record at -6.40% a year. Balaclava has the narrowest at 2.52 times and one of the mildest at -1.06%. Across the eight the correlation between the two is -0.90.
Eight suburbs is a small sample, so treat the pattern as a warning sign rather than a rule. When we widened the test to 38 Melbourne suburbs ranked by that gap, the pattern held. The bigger the apparent discount on a good postcode, the more it has tended to be telling you something about the stock.
Run the five year total return
A yield on its own tells you nothing. Put the rent and the capital together over a realistic hold and the picture is clearer. Prahran, on the figures above and holding both rates flat. Five years of rent at 6.19% is 30.95% gross. Five years of capital at -3.90% a year compounds to -18.04%. Add them and you are 12.91% ahead gross.
Then take the costs out. Body corporate, rates, insurance, management and the odd vacant week rarely leave more than two thirds of the gross rent on the table in an apartment. At 65% of gross rent retained, five years of Prahran returns 2.1%. At 55%, it returns -1.0%.
Melton on the same basis, at a 3.77% yield and 6.11% growth a year, returns 53.4% gross. So the outer suburb did far better despite the lower yield.
So the rent roughly cancelled the capital loss. You carried five years of body corporate, vacancy and market risk to finish near where you started. Over the same years a corridor house made about half its purchase price again.
Affordable and flat can mean early cycle
There is a real argument on the other side.
Markets that have gone sideways for years are often the ones about to move. The value is there, the yield is there, and nobody wants them, which is usually where a cycle starts. We buy on that logic regularly. Victoria sits earlier in its cycle than Queensland or Western Australia and that is much of why we are buying there at all.
Flat prices often come before a run, so check whether tenant demand in these particular markets is building or draining.
Vacancy across the nine postcodes
That is testable, so we tested it. SQM Research publishes vacancy by postcode. The eight suburbs above sit across seven postcodes, because Prahran and Windsor share 3181. We added Southbank and Richmond as inner-city apartment benchmarks, which makes nine.
| Postcode | August 2026 | March 2026 | Change |
|---|---|---|---|
| Southbank 3006 | 4.42% | 2.38% | +2.04 |
| St Kilda 3182 | 3.16% | 1.52% | +1.64 |
| Toorak 3142 | 2.83% | 1.37% | +1.46 |
| Elwood 3184 | 1.80% | 0.75% | +1.05 |
| South Yarra 3141 | 2.53% | 1.65% | +0.88 |
| Balaclava 3183 | 1.92% | 1.04% | +0.88 |
| Prahran and Windsor 3181 | 2.16% | 1.54% | +0.62 |
| Richmond 3121 | 0.85% | 0.40% | +0.45 |
| Armadale 3143 | 0.95% | 0.85% | +0.10 |
All nine rose, with Southbank, St Kilda and Toorak carrying most of it.
Two caveats belong here. Five months is a short window. March sits near the seasonal low for Melbourne vacancy while August is late winter, so some of this is calendar rather than market. The control for that is the outer corridors over the same five months. Melton eased from 2.79% to 2.68% and Werribee from 2.02% to 1.74%. Pakenham rose from 1.08% to 1.41%, which is still a smaller rise than eight of the nine inner postcodes.
The second caveat matters for the suburb we opened with. Prahran and Windsor’s 3181 rose 0.62 of a point to 2.16%, one of the smaller moves of the nine and not a loose rental market. Prahran’s case rests on its growth record rather than its vacancy.
What rising vacancy does not prove
Vacancy tells you the balance between tenants and dwellings. It does not tell you which side moved. Nine postcodes loosening at once while two of three corridors tightened is a real signal about inner Melbourne unit stock. Whether that is new apartments completing, tenants moving out to the corridors, or both, this data cannot say. We have not put approvals or completions figures in front of you. Treat it as a reason to check the supply pipeline around any building you are considering, not as a finished explanation. We since did that for one market and published the approvals working in Parramatta apartments: ten years, no capital growth.
When a Melbourne unit does work
None of this makes every unit a bad buy. We do buy them in the right situation.
A villa unit on its own title in a block of two to six, single storey, with a courtyard and a driveway, has a real land component. The body corporate is small and the growth profile sits much closer to a house than to an apartment. That is a different asset to a one bedroom apartment in a tower, even when the listing calls both of them units.
A $500,000 unit in a suburb where houses cost $1,600,000 is usually a different product with its own supply, and the size of the price gap is the clue.
What to check before you buy
Four checks, three of them free.
Check the five year average annual growth, not just the last twelve months. A single strong year on a weak five year record is noise.
Check vacancy in the actual postcode, both the level and where it was a few months back. One postcode moving proves little on its own. Check whether the rest of the city moved with it.
Check how many units sold in the year. Toorak’s unit median rests on 241 sales and fell 37.42% over twelve months. That is less a market losing over a third of its value than a median built on a small and shifting mix. It is why we lean on its five year figure and not its twelve month one.
Check the body corporate. That one is not public. It comes from the section 32 or the agent. It is also the difference between a 6.19% gross yield and what you actually bank.
Where the growth actually is
The Melbourne markets that have grown are the ones nobody puts in a brochure. Melton is $565,000 on a 3.77% yield with a 6.11% five year average. Melton South is $586,500 at 3.81% and 5.92%. Kurunjang is $615,000 at 3.64% and 6.45%.
Their yields are lower than Prahran’s, but every one of them has made money for five years while the blue chip units went backwards.
These results are specific to Melbourne. We ran the same numbers on Sydney and got the reverse, with all nine markets there growing, in Sydney units under $650,000. Closer to home, our guide to Melbourne suburbs under $500,000 covers the affordable end in detail. The best Melbourne suburbs to buy units lists the nine that pass on supply, vacancy and yield. Our piece on affordable versus blue chip covers why the lower-priced half of a city keeps outperforming the dearer half.
A yield high enough to notice is usually pricing something, which is the subject of capital growth versus rental yield.
If Melbourne is where you want to buy, a buyers agent in Melbourne should show you the vacancy trend for any postcode they put in front of you.
What the Prahran numbers add up to
Prahran pays 6.19%, level with South Yarra for the best yield in this group. Over five years that rent has roughly cancelled an 18.04% capital fall and left you close to square after costs. The same five years in Melton returned about half the purchase price. The yield looked like the best number in the table, but the five year price fall mattered more.
Data sources. Unit and house medians, weekly rents, twelve month growth, five year average annual growth and sales counts are CoreLogic figures accessed through Your Investment Property. Medians, growth and sales are to 30 June 2026 and rents are to 31 August 2026. Because those dates differ we do not quote published yields. We work out every yield here as weekly rent times 52 divided by the median. Five year returns are our own arithmetic on those two figures, holding both rates flat and before tax. Vacancy rates are SQM Research for August 2026 with the March 2026 reading alongside. All figures pulled 26 September 2026.
This is general information only and not financial advice. Speak to a qualified professional before making investment decisions.
If you are weighing a Melbourne unit against a house and want the vacancy and growth data on both before you commit, book a free discovery call.