
The serviceability wall stops most property investors at property two or three. You have the equity, the next deal stacks up on paper, but the bank runs its numbers and declines.
This is the point where portfolios stall before compounding really works. Here is why it happens and how to push past it.
Why Capacity Shrinks at Property Two
Three forces squeeze borrowing capacity as properties are added to a portfolio.
The assessment rate. Banks test every dollar of debt at the actual interest rate plus APRA’s 3 percentage point buffer. With the average variable investor rate at 7.22% in August 2026 (Finder), your loans are assessed at 10.22%. A $360,000 investment loan costs $3,066 per month in the bank’s serviceability model, even though actual interest-only repayments sit at $2,166. That $900 monthly gap between reality and what the bank models is capacity you never get to use.
Rental income shading. Banks do not count 100% of rental income. They apply a 20% to 30% haircut to account for vacancy, management fees and maintenance (APRA). If a tenant pays $480 per week ($2,080 per month), the bank counts $1,456 to $1,664. Every property you add widens the gap between the rent you actually collect and the income the bank recognises.
The DTI cap. From 1 February 2026, APRA limits banks to writing no more than 20% of new investment loans to borrowers whose total debt exceeds six times gross income. Once total lending crosses that line, most lenders decline outright rather than spend their limited high-DTI allocation on a standard deal. Loans for new dwellings are exempt, but most investors buying established houses are not.
How DTI Builds Across a Portfolio
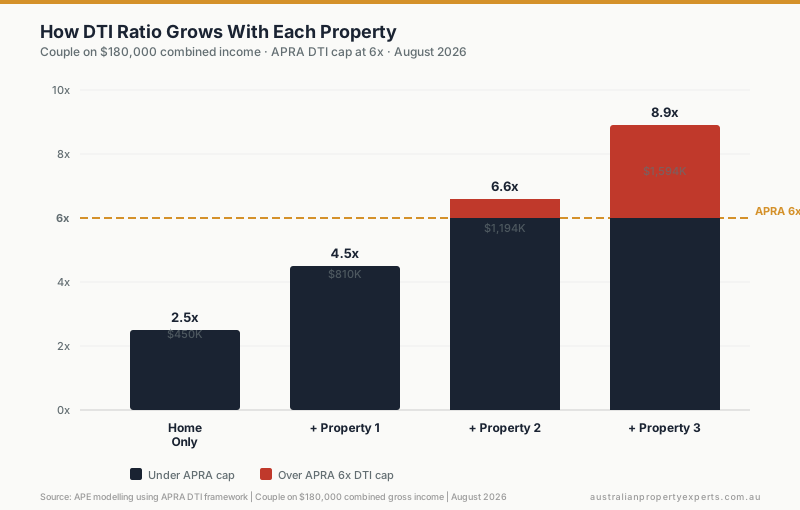
Take a couple earning $180,000 combined gross income. They own their home and want to build a three-property investment portfolio in affordable markets.
| Stage | New Loan | Total Debt | DTI Ratio | Status |
|---|---|---|---|---|
| Home loan | $450,000 | $450,000 | 2.5x | Under cap |
| + Property 1 ($450,000 at 80%) | $360,000 | $810,000 | 4.5x | Under cap |
| + Property 2 ($480,000 at 80%) | $384,000 | $1,194,000 | 6.6x | Over cap |
| + Property 3 ($500,000 at 80%) | $400,000 | $1,594,000 | 8.9x | Well over |
Property one lands comfortably at 4.5x. Property two pushes them past 6x, into the zone where most banks will not write the loan. Property three is unreachable at any ADI lender without a material change in income or debt structure.
Rental income from each property partly offsets the new loan in the bank’s model, but never fully. At 80% shading, a property renting for $450 per week counts as $18,720 per year of assessable income against an assessed annual repayment of $36,792 at the 10.22% buffer rate. Each property adds roughly $18,000 of net assessed cost. That net cost is what consumes the remaining capacity.
This is also why rental yield matters so much at this stage. Properties that deliver both growth and yield push back against the serviceability wall because the higher rent restores more income in the bank’s model. Growth alone builds equity for the next deposit. Yield is what keeps the bank willing to lend against it.
Eight Ways to Lift Borrowing Power
These are the practical levers. Each moves the number by a different amount, and most investors hitting the serviceability wall need a combination.
1. Cancel unused credit cards. Banks assess the full limit, not the balance. Every $10,000 in credit card limits reduces borrowing capacity by roughly $30,000 to $50,000 even at zero balance. Cancelling a $20,000 limit you never touch can free $60,000 to $100,000 of borrowing room in a single phone call.
2. Switch investment loans to interest-only. IO repayments lower the assessed monthly commitment on each loan. Across two investment loans, the switch from P&I to IO can free $50,000 to $100,000 in capacity. The cash flow difference also makes the portfolio easier to hold. The full comparison is in our interest-only vs P&I breakdown.
3. Choose your lender for policy, not rate. Two banks assessing the same applicant can produce capacity figures more than $100,000 apart. The differences sit in how each lender treats rental income shading (20% vs 30% haircut), overtime, bonuses, trust distributions and HECS thresholds. A broker who knows the policy matrix across 20 or more lenders finds capacity a single-bank relationship cannot.
4. Renovate for rent, not just value. A cosmetic reno that lifts rent from $420 to $490 per week means an extra $2,912 per year of assessable income after the bank’s 80% shading. Across two properties, the extra income starts to register in the serviceability assessment. The reno does double duty: it forces equity for the next deposit and lifts the rent that keeps the bank lending.
5. Pay down non-deductible debt first. A $30,000 car loan assessed at its monthly repayment burns capacity faster than $30,000 on an investment loan, because the investment loan generates rent that partly offsets. Clear personal loans, afterpay balances and buy-now-pay-later facilities before applying.
6. Separate every loan. Cross-collateralised loans tie the portfolio to one lender. That locks you out of the multi-lender strategy in point three and triggers full-portfolio revaluations every time you refinance. Standalone loans, each secured only by the property they fund, let you pick the best policy fit for each purchase. The structure costs nothing extra. The cross-collateralisation trap explains why this matters at every stage of a growing portfolio.
7. Time the application to rental increases. If a lease renewal in two months lifts rent by $40 per week, wait for the signed lease before applying. Banks assess current rent from the lease document, not projections. A signed lease at the higher figure is worth more than a verbal estimate from a property manager.
8. Add income. A side income, a spouse returning to work, or a granny flat added to an existing property all lift the income side of the serviceability calculation. A $20,000 increase in gross household income at a 6x DTI lifts the total allowable debt by $120,000. That can be the difference between a decline and an approval on the next property.
Non-Bank Lenders and the DTI Bypass
Non-bank lenders like Pepper Money, Liberty Financial and Resimac are not authorised deposit-taking institutions. They sit outside APRA’s regulatory framework. That means no DTI cap, no 20% quota, and their own internal serviceability models rather than the standardised 3% buffer.
The trade-off is price. Non-bank variable rates on investment loans typically run 0.5% to 1.5% above comparable bank products, and some specialist products sit higher again. For investors who can service the higher repayment but are blocked by the DTI cap at ADI lenders, the non-bank path keeps the portfolio moving.
There is a second bypass written into the rule itself, and it is worth knowing before a broker offers it to you. APRA exempts loans for the purchase or construction of new dwellings from the DTI limit (APRA). A borrower sitting at 6.6 times income can be declined on an established house and approved on a new build of the same price, at the same bank, on the same income.
That is a lending quirk, not an investment case. The exemption changes what you can borrow, not what the asset does afterwards, and the premium you pay at purchase plus the slower growth on new stock usually costs more than the borrowing headroom is worth. We have run that comparison in new build vs established. Worth knowing the exemption exists, mostly so you can tell whether a lender is solving your problem or selling you stock.
Demand for this path is growing. Pepper Money reported mortgage originations of $4.5 billion in the first half of 2026, up 63% year on year (The Adviser). Resimac’s home loan settlements rose 20% to $5.9 billion for financial year 2026. That growth is coming from borrowers the banks are declining under the new DTI rules.
A mortgage broker who works across both ADI and non-ADI panels can show you the rate difference on your specific deal. Sometimes the answer is a bank at a lower rate with a smaller loan. Sometimes it is a non-bank at a higher rate with enough capacity to fund the right property. The question is not which is cheaper per dollar. It is which structure adds the next property to the portfolio.
When to Hold Instead of Buy
The serviceability wall is not always a signal to push harder. Sometimes it is telling you something worth hearing.
If every strategy above has been deployed and the portfolio still cannot support another loan, the right move may be to hold and let the existing properties do their work. Rents rising across the portfolio push more income into the bank’s serviceability model each year. Organic growth creates new equity. A rate cut, if one arrives, widens the gap between the actual rate and the assessment rate by more than the cut itself, because the buffer stays fixed at 3%.
The investors who build the largest portfolios rarely buy every year. They buy in clusters when capacity, equity and market conditions align, then hold while the portfolio compounds. Our equity recycling guide walks through the compounding math at each stage and shows how the cycle accelerates as more properties enter the loop.
The question is not whether you can force another loan today. It is whether the portfolio, as it stands, is positioned so the next purchase becomes possible naturally within 12 to 18 months.
This is general information only and not financial or lending advice. Borrowing capacity depends on your specific lender, income, and existing commitments. Speak to a qualified mortgage broker for a current assessment.
If you want a strategy that maps your capacity to the right markets, book a free discovery call.