Australian home values fell 0.7% in July, the steepest monthly decline since December 2022 and the fourth straight fall since the Australian property market peaked in March. That is the headline from Cotality’s latest Home Value Index, and on its own it sounds like the start of something ugly.
The headline hides the real story. Over the year to June, five capitals grew between 9% and 24%, two barely moved, and one went backwards. This is not one national downturn. It is a correction concentrated in specific markets and specific price points, while other markets keep climbing through it.
What the Latest Cotality Data Shows
The national index dropped 0.4% in June, then 0.7% in July. Sydney is leading the falls, down 1.4% in July after a 3.2% decline over the June quarter. Melbourne fell 1.2% in July. Brisbane and Adelaide, which held up through autumn, have now joined them with modest falls of 0.6% and 0.2%.
At the other end, Darwin rose another 0.8% in July with annual growth of 16.3%, and the year-to-June numbers show how wide the spread has become.
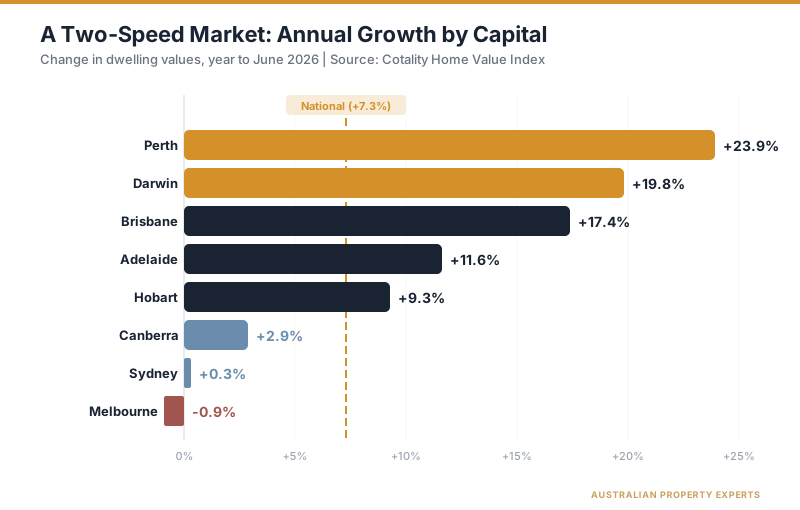
Perth added 23.9% over the year to June. Darwin added 19.8%, Brisbane 17.4%, Adelaide 11.6%, Hobart 9.3%. Sydney managed 0.3%, Canberra 2.9%, and Melbourne went backwards at -0.9%. The national figure of 7.3% annual growth is an average of markets that have almost nothing in common right now.
Regional Australia is outperforming the capitals too. The combined regionals index rose 0.3% in June and 1.1% over the quarter, against a 1.3% quarterly fall for the combined capitals. Regional WA led the country with 3.7% quarterly growth.
Premium Suburbs Are Falling First
The falls are not evenly spread within cities either. Upper-quartile home values fell 3.2% nationally over the three months to July. The expensive end of Sydney and Melbourne is where this correction lives.
That pattern is familiar. Premium markets swing hardest in both directions because their buyers carry the biggest mortgages and feel rate changes first. Affordable markets, the segment we buy in, are showing nothing like it. The affordable versus blue-chip data has pointed this way for years, and this downturn is proving the point in real time. Cheaper markets with tight rental supply are holding their value or still growing while the prestige end repriced.
Why Buyers Have Pulled Back
Three forces are driving the correction.
Rates. The RBA has lifted the cash rate by 75 basis points across 2026 to 4.35%, and held it there through June and July. Higher repayments have cut what buyers can borrow, and serviceability hurdles are biting even where intent is strong.
Tax changes. The Federal Budget’s negative gearing and CGT changes are weighing on investor demand for established dwellings. Cotality expects a sharp pullback in that segment, and it showed up early in the sales data.
Confidence. Capital city home sales over the three months to June ran 16.2% below the same period last year and 14.5% below the five-year average. Auction clearance rates have sat below 50% since late May. Advertised stock is roughly 11% higher than a year ago, and Cotality is blunt about why. It is not a wave of new listings. It is unsold stock accumulating because demand has thinned.
Rents and Yields Are Still Climbing
While values soften, the rental market has not blinked. Cotality’s national rental index rose about half a percent a month through autumn and 5.9% over the financial year. National rental vacancy sat at 1.6% in June on Cotality’s measure, well below the decade average of 2.5%.
Falling values plus rising rents means yields keep improving. Gross yields across the combined capitals now average 3.50%, up from a record low of 2.92% in January 2022. For investors, that is the quiet good news inside a soft market. Every month values drift and rents climb, the growth-and-yield equation tilts a little further toward buyers who can hold.
The caveat is that yields still trail borrowing costs in most suburbs. With variable investor rates averaging around 6.4%, Cotality’s May research found only 0.8% of suburbs nationally offered a cash flow positive opportunity at a 20% deposit. Yield strategy in 2026 means picking the small set of markets where the numbers genuinely work, not assuming any cheap suburb pays for itself.
What This Means If You Are Buying Now
Cotality’s own framing is that conditions are improving for buyers prepared to move against the current. More stock to choose from, longer selling times, softer auction results, and vendors who have to negotiate. Buyer leverage is the best it has been in several years.
The two-speed nature of the market means the play is different depending on where you look. Markets with tight vacancy and strong yields, Darwin being the clearest case, are still rising through the national downturn. The premium end of Sydney and Melbourne likely has further to fall. KPMG’s August revision expects national house prices to fall 1.1% over the remainder of 2026, with Sydney down 4.4% and Melbourne down 5%, while Darwin stays the strongest capital at 8.1% growth. It then expects conditions to stabilise in 2027.
Whatever the RBA does next week, waiting for the perfect entry has a worse track record than buying on fundamentals: vacancy, yield, supply pipeline, and employment. Those numbers are knowable today.
What to Watch This Month
The RBA on Tuesday 11 August. Another hike would extend the correction in rate-sensitive markets. A hold would give spring some footing after four months of falls.
July CPI on Wednesday 26 August. The monthly inflation read shapes the spring rate calls. Cotality notes underlying inflation is still above target, which is why the case for another hike has not disappeared.
SQM’s July vacancy numbers, due mid-August. National vacancy ticked up from 1.2% to 1.3% in June. If it keeps drifting while values fall, the rental squeeze is easing at the margin. If it snaps back, yields keep firming.
Cotality’s August index, due early September. A fifth consecutive monthly fall would confirm the downturn has legs into spring. Watch whether Brisbane and Adelaide’s falls deepen or stabilise.
A Correction at the Top, Not a Crash
The national headline is being dragged down by premium Sydney and Melbourne stock while affordable, high-yield markets keep growing. Sales volumes and clearance rates say vendors are under more pressure than at any point since 2022, which is exactly when prepared buyers do their best work. The data tells you where the falls are. It also tells you where they aren’t. If where they aren’t is where you want to buy, our buyers agent Perth and buyers agent Darwin pages cover the two markets leading the country.
This is general information only and not financial advice. Speak to a qualified professional before making investment decisions.
If you want to know which markets the data supports right now, book a free call.
Sources: