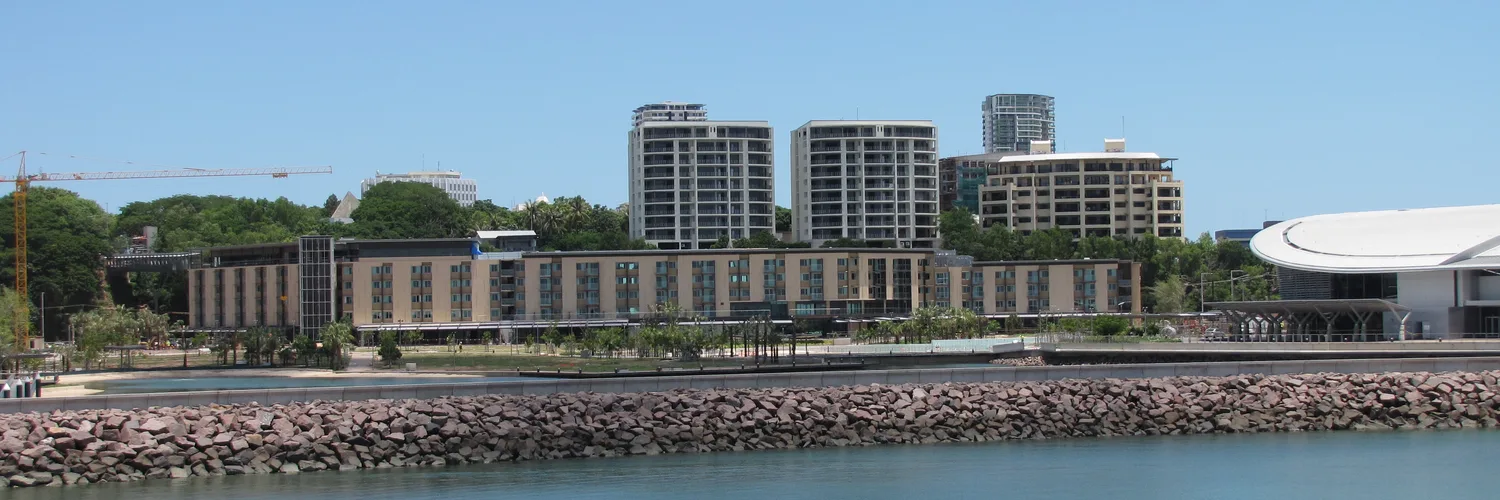
Darwin is Australia’s lowest-priced capital city and its highest-yielding property market in 2026. Those two things being true at the same time, while vacancy sits at 0.4%, is why investors are paying attention.
Darwin values went almost nowhere from 2016 to 2021, and that long reset is why this run has room left. The current cycle has real employment behind it, and the numbers are the strongest of any capital.
Where Darwin Sits in 2026
Cotality’s Home Value Index put Darwin’s median dwelling value at $647,259 at 31 August 2026. That is up 14.6% over the year, 0.9% over the quarter and 0.6% for the month. Houses sit higher at $755,296. Units are climbing faster, with annual unit value growth of 18.0%.
That result came while the rest of the country went backwards. The combined capitals fell 1.1% in August and 3.7% over the three months. Darwin was the only capital city where values rose over that quarter. The national index had already fallen in July, and August’s 0.9% national fall extended the slide.
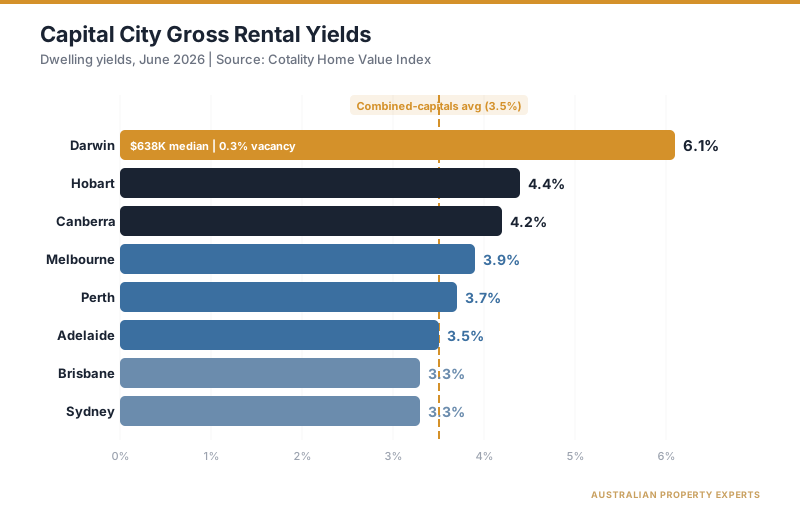
Gross rental yields are the standout metric. At 6.3% for dwellings and 7.4% for units, Darwin leads every other capital by a wide margin. The combined-capitals average is 3.6%. Hobart is next-best at 4.4%, Canberra sits at 4.3%, Melbourne at 4.0% and Perth at 3.9%. Brisbane is at 3.4% and Sydney at 3.3%.
SQM Research counted just 94 vacant rental dwellings across Darwin in August 2026, a vacancy rate of 0.4%. SQM has had Darwin below 0.5% every month since March 2026, the tightest rental market of any capital city. Combined asking rents rose 12.9% over the year, the fastest of any capital.
Why Darwin Is Early in the Cycle
Darwin’s last upswing was tied to LNG construction. When that build finished, the workforce left, population growth stalled and values went sideways for years.
Cotality’s figures show how long that lasted. Darwin dwelling values are up 34.0% over 10 years and 30.6% over five. That leaves roughly 2.6% of growth across the five years to August 2021. Over the same decade Brisbane rose 111.8% and Sydney 44.4%.
Nearly all of Darwin’s decade of gains came in the last five years. The first five were close to flat.
This matters because it shapes how you read the current data. Annual growth in the mid teens sounds like Perth’s recent run. But Darwin reached that number partly because the base was so depressed. Cotality has Darwin at a record high today. Even so, the past decade is a story of recovery first and compounding only recently.
Read as a cycle position, that is the case for Darwin. The capitals that boomed through the past five years are carrying those gains in their prices. Perth is up 79.7% over five years, Brisbane 64.1% and Adelaide 64.0%, against Darwin’s 30.6%. Darwin is earlier in its run than any other growth capital, with a 6.3% gross yield against their 3.4% to 3.9%. Long flat periods reset a market’s affordability. Darwin enters this cycle as the one growth capital where a boom is not already priced in.
Understanding how capital growth and rental yield interact over time is the key here. Yield carries you through the flat years. Growth, when it comes, is a bonus.
Defence, Gas, and New Jobs
What separates this cycle from the 2016-2021 hangover is the employment pipeline.
The Department of Defence says work continues on upgrades to RAAF Bases Darwin and Tindal under the United States Force Posture Initiatives. Those initiatives include the Marine Rotational Force in Darwin, and they bring infrastructure investment and support work to the Top End.
On the energy side, the first Barossa LNG cargo left Darwin LNG on 25 January 2026. Santos says the project will secure about 300 permanent jobs in the Northern Territory for the next 20 years.
The defence upgrades are underway. The LNG plant is operational and producing. Together they underpin a tenant base of defence personnel, gas workers, and the service economy around them. That is what drives rents, and rents are what make the yield case work.
Territory Incomes
The tenant and buyer base earns more than most of the country. ABS employee earnings data puts the Territory’s median weekly earnings at $1,510 in August 2025. That is second only to the ACT’s $1,600 and ahead of every state. High wages against the lowest capital city median in the country mean serviceability and rent affordability stretch further in Darwin than anywhere else.
The $750k Cap and the Rental Squeeze
The Australian Government’s 5% deposit scheme price cap for Darwin is now $750,000, while the rest of the NT sits at $600,000. With the median dwelling at $647,259, most of Darwin’s established market is within reach of first home buyers on a 5% deposit. They can buy with no lenders mortgage insurance. More qualified buyers at the entry level is direct demand support at exactly the price points investors buy in.
The rental side is moving the other way. Vacancy is at 0.4%, with 94 vacant rentals in the city and combined asking rents up 12.9% a year. Two subtractions are landing on top of that. NRAS ended in June 2026, and the ANAO counted around 1,250 NT allocations under that scheme for below-market rentals. KPMG also says the negative gearing changes in the 2026-27 Federal Budget have weakened investor sentiment. In Darwin that means fewer rentals added to a market that has almost none to spare. Unless new supply picks up sharply, the pressure on Darwin rents from here is up.
The Strongest Cash Flow of Any Capital
Darwin’s 6.3% gross yield on dwellings is the highest of any capital. But in Darwin, building insurance changes the holding maths more than in any southern capital.
The ACCC found that the average home and contents insurance premium in the Northern Territory was above $3,500 in 2024-25. That compares with $2,310 across the rest of Australia. Cyclone risk is the driver. The Australian Government’s cyclone reinsurance pool has helped, with home premiums in higher-risk areas falling 11% in the first year after insurers joined the pool. Costs still sit well above southern-capital norms.
The insurance objection is real but smaller than most investors assume when measured against the yield gap. On the ACCC averages, the NT premium runs about $1,200 a year above the rest of Australia. At 6.3% gross, a $600,000 Darwin house generates roughly $37,800 in annual rent. The same property at the combined-capitals yield of 3.6% would generate $21,600. That is $16,200 more gross rent per year, against an insurance gap of around $1,200 on those averages.
Then there is the land tax offset. The NT is the only Australian jurisdiction with no land tax at all. An investor holding three properties in NSW or Victoria might be paying $5,000 to $15,000 a year in land tax across those holdings. A Darwin property adds zero to that bill. Over a 10-year hold, the land tax saving alone can reach $50,000 to $150,000 compared to holding the same asset in a taxing state.
Net of insurance and after the land tax offset, Darwin delivers the strongest cash flow of any capital city. The 6.3% headline is not your actual yield after expenses. The gap between Darwin and everywhere else is still wide enough that insurance does not close it.
What to Check Before You Buy
Darwin’s numbers are strong. Four things belong in your due diligence before you commit.
The cycle history. Darwin’s past upswings were tied to resource construction and flattened when the builds finished. The current cycle is better diversified across defence and gas. It is still the pattern to understand, and it is why we buy here on yield first.
A small, concentrated market. Defence and gas drive the jobs market. Greater Darwin’s population of 159,284 at 30 June 2025 makes it the smallest capital city market in Australia. Net interstate migration to the NT was negative at -456 people in the March quarter 2026, with growth coming from overseas arrivals and births. A smaller market means selling takes longer when conditions cool, so buy with a hold horizon rather than a quick exit in mind.
Insurance costs. Premiums in the NT sit above southern-capital norms and a bad cyclone season can reprice the region for years. Get a quote on the specific property before you make an offer. Then run it through the cash flow numbers rather than assuming a southern-state figure.
Growth will moderate. KPMG’s January 2026 outlook projected Darwin house price growth of 10.5% for 2026 and 6.8% in 2027. By August it had cut its national house forecast to a 1.1% fall for 2026. It still ranked Darwin the strongest capital in the country, at 8.2% house price growth. The rate of gains will settle as the base rises. The yield is what you buy for; growth at the top of the national table is the kicker.
None of these change the case. They are the reasons to buy Darwin with data, street by street, rather than off a headline.
Where Darwin Fits a Portfolio
Darwin works best as a yield anchor in a diversified portfolio rather than a standalone bet. If you already own in a higher-growth, lower-yield market like Brisbane or Perth, a Darwin property adds cash flow that helps serviceability for your next purchase.
Entry starts in the mid $500,000s for established houses in Palmerston suburbs such as Moulden, where rent can cover most or all of the loan interest from settlement. Established properties on decent blocks are the target. Not new builds, not off-the-plan apartments, not high-density units in oversupplied buildings. Older houses with cosmetic reno potential and granny flat feasibility give you levers if the market flattens.
If you live outside the Territory, our guide to buying investment property interstate covers how remote purchases work from search through to settlement.
If you are weighing Darwin against other more affordable capitals, the comparison is straightforward. Perth has the stronger growth track record, but at a median of $999,987, entry costs 54% more. Brisbane offers better long-term growth diversification, but its yields are little more than half of what Darwin delivers. The right answer depends on what your existing portfolio needs most.
The Case for Buying Darwin in 2026
Darwin gives an investor the strongest starting numbers of any capital. It has the lowest entry price, the highest yield, the tightest vacancy, no land tax, and an employment pipeline already underway. Cycles moderate eventually, which is why we buy at a yield that carries the property regardless of what growth does next.
Right now, the yield does that job with room to spare. A 6.3% gross return with no land tax and genuine tenant demand is a cash flow position backed by defence and energy employment. Insurance is the line item to price carefully, and in a market this small you buy street by street.
For the suburb-level numbers behind that citywide picture, see the best suburbs to invest in Darwin, where five suburbs pair yields near 6% with double-digit growth.
This is general information only and not financial advice. Speak to a qualified professional before making investment decisions.
If you’re considering Darwin for your next investment, book a free call.
Sources:
- Cotality - Home Value Index, August 2026 results (data to 31 August 2026)
- SQM Research - Darwin vacancy rates, August 2026
- SQM Research - Darwin weekly asking rents
- Department of Defence - United States Force Posture Initiatives
- Santos - First Barossa LNG cargo
- ACCC - Cyclone reinsurance pool insurance monitoring
- ABS - Estimated resident population, Greater Darwin
- ABS - Population components, Northern Territory
- ABS - Employee earnings, August 2025
- Australian Government 5% Deposit Scheme - property price caps
- Master Builders NT - Darwin cap lifted to $750,000
- ANAO - Administration of NRAS (state allocation shares)
- KPMG - Residential Property Market Outlook, August 2026