Should you buy property now, with rates at 4.60%, new tax rules legislated, values falling and everyone you know saying wait? It is the question hanging over every purchase right now. So let’s answer it by looking at what markets that felt exactly like this one did next.
How scared is the market in 2026
The numbers say the market is very scared. The Westpac-Melbourne Institute consumer sentiment index fell to 84.4 in September, back near the lows of earlier this year. July’s 83.9 was in the bottom 10% of readings in the survey’s 50-year history. The “time to buy a dwelling” sub-index hit 72 in May, nearly 50 points below its long-run average of 119. House price expectations fell 34.5% in a year. The crowd has flipped from fearing they’ll miss out to fearing prices will fall.
Behaviour matches the mood. Combined-capital auction clearance ran at 49.1% in the week ending 20 September, 22.5 points below the same week last year. Brisbane cleared 31.4%. It was its 17th straight week under 40%. Clearance has been under 50% in 15 of the past 17 weeks.
Capital city listings in the four weeks to 30 August were 24% higher than a year ago and 8% above the five-year average (Cotality). Cotality estimates home sales over the past quarter ran 15.5% below the same time last year. Investor loan numbers fell 8.6% in the June quarter (ABS).
National values fell 0.9% in August, a fifth straight monthly fall. Sydney dropped 1.4% and Melbourne 1.1%. That leaves the national index 3.6% below its March 2026 peak, at a median of $912,885.
From a buyer’s side, that same list reads differently. It means more stock to choose from, fewer bidders next to you, agents calling back, vendors negotiating, and five months of falling prices as your anchor. Every condition that makes buying hard in a boom has reversed.
The markets that skipped the last correction are on sale
One detail in the latest numbers matters more to investors than the national figure. It is the reason this downturn is not simply a rerun of 2022.
In calendar 2022, the last time everyone agreed property was falling, it was not falling everywhere. Sydney and Melbourne took that correction while Adelaide rose 10.1%, Darwin 4.3% and Perth 3.6% over the same year. The mid-sized capitals sat it out. They kept running instead, for years. Over the five years to August 2026 Perth was up 79.7%, Brisbane 64.1% and Adelaide 64.0%. Sydney rose 5.6% and Melbourne fell 3.9% over the same five years (Cotality). If you invest in affordable, higher-yielding markets, you spent that whole stretch buying into a rising market with competition beside you.
That has now changed. Brisbane and Adelaide both peaked in May 2026 and have fallen since, Brisbane by 2.7% and Adelaide by 1.6%. Perth is 3.2% below its April peak. All three fell in August, Brisbane by 1.0% and Adelaide and Perth by 0.8%. The downturn has finally reached the markets that avoided the last one.
So “everything is on sale” needs to be more specific than the headline suggests. Nationally this is not yet the deepest correction in recent memory. The 2022-23 fall took 7.5% off national values, against 3.6% so far this time. Sydney is the exception. It is falling faster than it did in 2022-23. Our comparison of affordable versus blue-chip markets covers the difference.
But in the corridors we actually buy in, this is the first genuine buyer’s window since the 2020 run began. Investors miss this when they read national headlines about markets they don’t buy in.
May 2020: forecasts vs what happened
The cleanest test of fear as a forecast came in May 2020. With auctions banned and the economy in lockdown, CBA’s worst-case scenario had home values down 32% by March 2023. Its base case was an 11% fall over three years. Westpac’s baseline was a 20% slide. All four major banks expected double-digit falls. These were the country’s biggest lenders, publishing with full conviction.
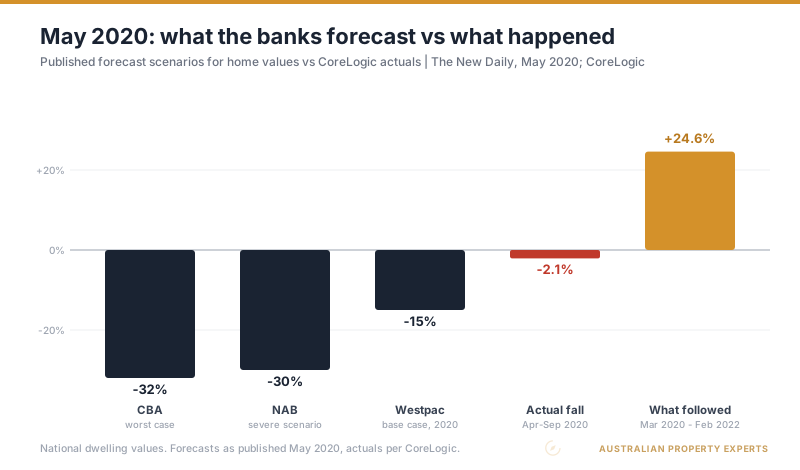
The actual fall was 2.1% between April and September 2020. National values then rose 22.4% in the year to January 2022, the fastest annual pace since June 1989. From the end of March 2020 to February 2022 they rose 24.6%. The buyers who transacted into the fear bought at the bottom of that entire sequence. The ones who waited for the banks’ scenarios to play out paid 20% more for the same houses two years later.
2008, 2019, 2023: same fear, same ending
That was not a one-off.
2008. The ABS eight-capital house price index fell 3.3% over 2008 as the GFC hit. The following year, the same index rose 13.6% over 2009, with Melbourne up 19.7%. Rate cuts and first home buyer support had met a market everyone had written off.
2019. This is the closest cousin to today. National values fell 8.4% from October 2017, with Sydney down 14.9%. Credit was squeezed. A federal election was fought partly on limiting negative gearing. Investor lending was still shrinking in May 2019. The national index floored the next month, in June. CoreLogic’s Tim Lawless described what followed as a fast-paced rebound through the second half of the year. Rate cuts in June, July and October helped.
2022-23. The fastest rate tightening in a generation cut national values 7.5% in nine months, to a floor in January 2023. Most forecasters expected more falls. Ten months later the index was at a new record high, up 8.1% from the trough. Cotality’s Tim Lawless noted at the time that the “‘V’ shaped recovery may seem counter-intuitive” given high rates and deeply pessimistic sentiment. Demand had simply been running ahead of supply the whole way through the fear.
Three different fears played out with the same shape. The sentiment trough and the price trough arrived close together. The recovery started while the headlines were still grim. Nobody rings a bell. By the time sentiment feels comfortable again, the discount is gone.
The early tells this time are mixed. The time-to-buy index rallied from 72 in May to 95.7 in August, then gave it all back to 85.5 in September on rate-rise fears. In July, Ray White’s auction data showed investors drifting back after the budget shock.
When buying the dip goes wrong
Buying in a downturn does not always work.
Low sentiment is not, by itself, a buy signal, and Perth shows why. On the ABS index, Perth prices fell 14.2% between the June quarter 2014 and the September quarter 2019, more than five years of decline. Anyone who “bought the dip” in early 2015 waited until late 2021 to see the index back at that level. Melbourne today sits 6.8% below its March 2022 peak, more than four years on.
And 2026 has genuine differences from 2019. The tax change is law this time. Every rebound above came with rate cuts, and there have been none yet in 2026.
The Reserve Bank raised the cash rate to 4.60% on 29 September 2026, its fourth increase of the year. The lower rates that powered each of the recoveries above are not here yet. The case for buying now has to stand on price and competition, not on an assumption that relief is weeks away.
What separated Perth 2014 from every rebound story above was the fundamentals. Perth’s downturn came with a mining-driven population bust and years of oversupply. The rebounds happened where demand kept outrunning supply beneath the fear. That is precisely the check that matters now. It is why we keep publishing the supply-side data.
Cotality’s latest read is that new housing supply remains insufficient relative to underlying demand. National vacancy on Cotality’s measure was 1.9% in August, still well below the pre-COVID decade average of 3.3%.
Fear with a supply shortage underneath it has historically resolved upward. Fear with oversupply underneath it, as Perth showed, has not.
Hold 9 years, not 4
One more dataset matters here. The point of buying in a fear market is what the asset does over the following decade, not the following quarter. Cotality’s latest Pain and Gain report analysed more than 94,000 resales in the June 2026 quarter. Of those, 95.4% sold at a nominal profit, down from a 21-year high of 96.1% in March, with a median gain of $371,000. Houses sold at a loss had been held for a median of 4.4 years. Houses sold at a profit had been held for 9.3 years. The difference between a profit and a loss was mostly how long people held.
How to buy in a fear market
None of this is a promise that September 2026 is the exact bottom. Nobody can pick the bottom, but the data does support four points.
- Competition is measurably thin. Sub-50% clearance and rising stock mean negotiation leverage that did not exist 18 months ago and will not survive the next sentiment turn.
- Buy fundamentals, not the dip. Tight vacancy, real yield, supply running behind demand, priced below replacement cost. If those boxes tick, low sentiment is a discount. If they don’t, it’s Perth 2014.
- Structure for the new rules, not the old ones. Post-budget purchases carry the 2027 tax treatment, which rewards properties that pay their own way. Buy the yield first and let rate cuts be upside, not the rescue plan.
- Stress-test at today’s rates. If the numbers only work after the RBA cuts, the numbers don’t work.
The pattern in every episode above is that the window closed quickly and quietly. Homebuyer sentiment is still above its May floor, even after September’s pullback. The same data that eventually makes buyers comfortable again will also remove the discount.
Fear is a price signal
Every rebound in this post was bought by people who transacted while the consensus said wait, in markets where the fundamentals disagreed with the mood. The mood right now is back near its 2026 lows. The fundamentals, in the corridors that matter, are not. In past cycles, buyers who waited for the market to feel safe paid more. For where the falls are actually landing, month by month, see the August 2026 market update.
Sources
- Consumer Sentiment Bulletin, September 2026, Westpac-Melbourne Institute
- Consumer Sentiment Bulletin, July 2026, Westpac-Melbourne Institute
- Final auction clearance rates, week ending 20 September 2026, Cotality
- Cotality Home Value Index, September 2026 release (index results as at 31 August 2026)
- Lending indicators, June quarter 2026, ABS
- Monetary policy decision, 11 August 2026, RBA
- Decline in home values breaks records (calendar 2022 by capital), CoreLogic via Broker Daily
- CBA and bank COVID forecasts, May 2020, The New Daily
- How COVID shaped the housing market, CoreLogic’s Eliza Owen
- CoreLogic dwelling values, January 2022, Savings.com.au
- Established house price indexes, December 2008, ABS
- Established house price indexes, December 2009, ABS
- 2019: the year of records, CoreLogic via Broker Daily
- V-shaped recovery to a record high, November 2023, Cotality via Property Update
- Residential property price indexes, eight capital cities, ABS
- Pain and Gain, June quarter 2026, Cotality
- Investors returning after budget blow, Ray White data via AAP
This is general information only and not financial advice. Past market cycles are not a promise about this one, and nobody can time the exact bottom of any market. Speak to a qualified professional before making investment decisions.
See how we find the corridors where the fundamentals disagree with the mood.
If you want to know whether the numbers stack up on a purchase this quarter, not in theory but on a specific brief, book a free discovery call.