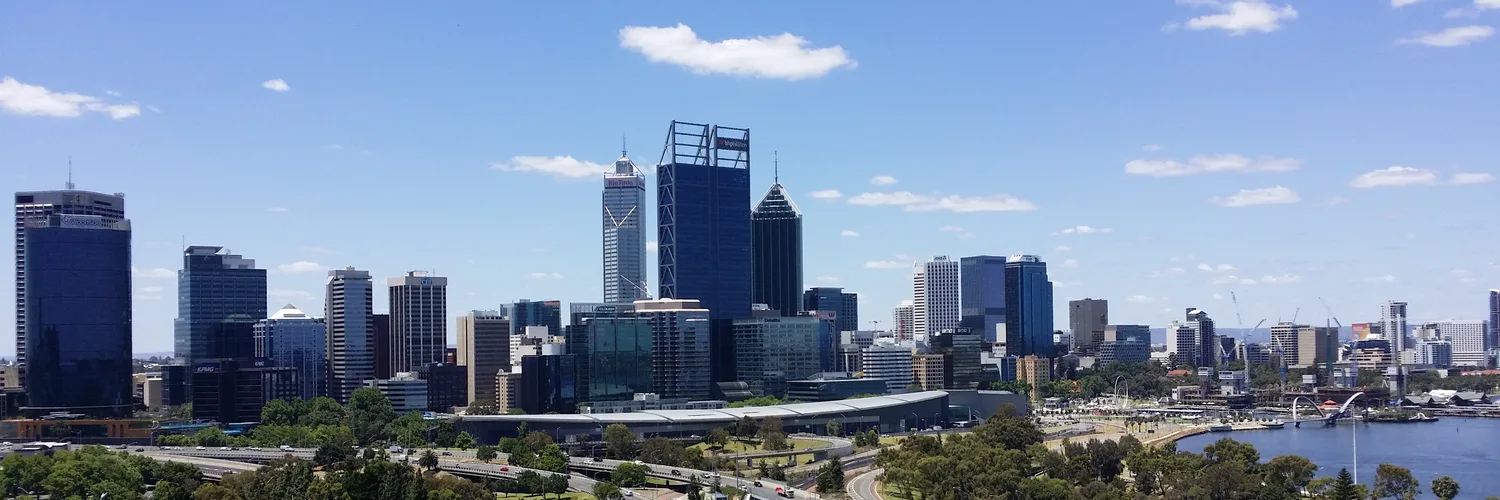
Perth’s median dwelling value is $999,987, up 15.6% over the year, on Cotality’s Home Value Index at 31 August 2026. Houses sit at $1,043,478 and units at $733,223.
That annual number is still the strongest of any capital city. The quarterly one has turned. Perth fell 3.2% over the three months to August and 0.8% in August itself. Cotality also revised July from +0.1% to -1.3%. After a 79.7% rise over five years, values are now going backwards.
The fundamentals underneath it have not changed. WA’s population grew 2.1% in the year to March 2026, the fastest of any state or territory, according to the ABS. METRONET’s 72 kilometres of new rail and 23 new stations are finished. SQM Research has metro vacancy at 0.61% in August 2026. What has changed is what a purchase made this month can reasonably be expected to do. Buying Perth now is a bet on those fundamentals holding, rather than on the last three years running again.
The nine suburbs below span $695,000 to $1,190,000. They were picked on median, yield, vacancy, infrastructure pipeline and how many different industries the local jobs come from. That last one matters more than it sounds. A 4.5% yield propped up by one employer is a different proposition to the same 4.5% behind health, retail, education and government. Our guide to capital growth vs rental yield works through the trade in more detail.
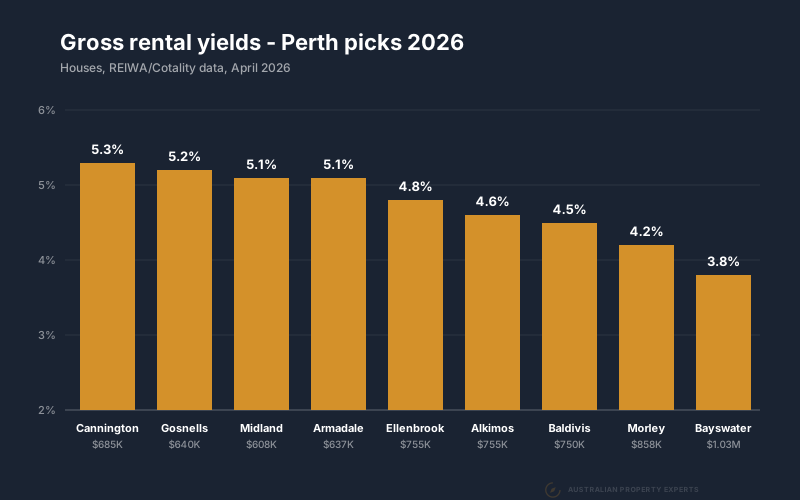
Houses, rent x 52 / median. Each suburb uses the lower-yielding of two pairs. REIWA covers the 12 months to August 2026. CoreLogic via YIP has medians to June 2026 and rents to August 2026.
Read the list and one split shows up straight away. Cannington, Midland and Armadale pay the most rent per dollar, at 4.68% to 4.88% on medians of $695,000 to $800,000. In the established middle ring, Morley and Bayswater, the yield drops to 4.12% and 3.50%. The growth has not pulled ahead to make up for it. Both grew less over the year than Cannington, Midland or Gosnells.
Whether any of these counts as a good yield depends on your loan rate. Our guide on what is a good rental yield sets out that test. To check a listing you are looking at, put its price and rent into the rental yield calculator.
Midland
Median house price: ~$695,000 Gross rental yield (houses): ~4.86% Median weekly rent: ~$650 12-month growth: ~20.3%
The new Midland Station opened on 22 February 2026, the last piece of the METRONET build. It came with a multi-storey car park of more than 800 bays and a 12-stand bus interchange.
Midland is a working hub rather than a dormitory suburb. St John of God Midland Public Hospital is the anchor employer. Midland Gate carries the retail. A logistics and trades precinct has been growing there for years. Perth’s eastern suburbs use Midland the way a regional centre gets used.
Which is why 20.3% growth in twelve months is not surprising. At $695,000 you are still buying infrastructure upside under $700,000, on a 4.86% yield. The cash flow buffer will keep thinning if the price keeps moving faster than the rent.
Armadale
Median house price: ~$700,000 Gross rental yield (houses): ~4.68% Median weekly rent: ~$630 12-month growth: ~17.9%
Armadale carries a reputation, and that reputation is most of the reason the numbers look like this.
The infrastructure argument is simple enough. The Armadale Line reopened in October 2025 with an elevated Armadale Station and the Byford Rail Extension. Nine level crossings between Armadale and Byford went in the process. The Thornlie-Cockburn Line opened in June 2025 and links the corridor across to the Mandurah Line, so the south-east has cross-city rail for the first time.
Armadale’s 17.9% over the year trails Cannington, Midland, Gosnells and Ellenbrook, on the second-lowest median here. The yield is 4.68%, third on the list. Look past where Armadale has traditionally sat on the desirability rankings. You are buying a suburb whose rail changed permanently in October 2025, at a price below most of this list.
Gosnells
Median house price: ~$760,000 Gross rental yield (houses): ~4.48% Median weekly rent: ~$655 12-month growth: ~20.0%
Gosnells is the corridor’s cautionary tale on timing. It sits between Cannington and Armadale on the same reopened Armadale Line. The new cross-city link serves it too.
But price ran 20.0% while REIWA has rents up only 5.6%. At 4.48% it is now the weakest yield of Midland, Armadale, Gosnells and Cannington. Today it is a compromise between cash flow and growth.
The underlying suburb is fine. There is industrial and logistics work along Tonkin Highway and retail in the town centre. Armadale and Cannington are both close enough to draw on for health and commercial jobs. The point is only that you are paying $760,000 here for what $700,000 buys further down the same line.
Cannington
Median house price: ~$800,000 Gross rental yield (houses): ~4.88% Median weekly rent: ~$750 12-month growth: ~26.2%
Cannington has the best computed yield on this list, 4.88% on an $800,000 median. It also grew fastest, at 26.2%. REIWA puts it ten kilometres from the CBD.
Those facts do not usually appear together. Bayswater is closer at seven kilometres and pays 3.50%. Morley is nine kilometres out and pays 4.12%. Cannington pays 4.88%, and the reason is Westfield Carousel anchoring an economy that does not lean on the CBD.
It also has a designation worth knowing about. Cannington is a Strategic centre under WA’s State Planning Policy 4.2. That is the state saying, in advance, that it expects housing and jobs growth here. The new elevated station on the Armadale Line is part of the same picture.
Worth a look at the units too. On CoreLogic figures via YIP, a $698 unit rent on a $625,000 median computes to about 5.8%.
Ellenbrook
Median house price: ~$850,000 Gross rental yield (houses): ~4.59% Median weekly rent: ~$750 12-month growth: ~18.9%
Ellenbrook waited more than a decade for a train line. The 21-kilometre Morley-Ellenbrook Line opened on 8 December 2024.
Before that, Ellenbrook was a well-planned family suburb with decent schools and good retail. What it lacked was any realistic way of getting to work without a car. The rail line did not improve the suburb so much as remove the single objection to it.
At $850,000 and 4.59%, the premium is partly in already, and 18.9% over the past year is where it went. The City of Swan, which takes in Ellenbrook, grew 4.0% in the year to June 2025 on ABS figures. The train is what makes that population sustainable rather than just planned.
Morley
Median house price: ~$946,500 Gross rental yield (houses): ~4.12% Median weekly rent: ~$750 12-month growth: ~16.9%
Be clear about what this one is. At 4.12% on a $946,500 median, Morley will not cover its holding costs. Only look at it if you have the income to carry the gap.
What you get for that is a genuinely established middle-ring suburb. It went from no rail to a station on the new Ellenbrook Line. Morley Galleria is a serious commercial precinct. Buses link it to the station. The suburb is nine kilometres from the CBD and close to the airport. The local jobs spread across retail, health, education and professional services rather than clustering in one of them.
Middle-ring Perth has almost no new land. New infrastructure plus fixed supply is the combination that has moved prices everywhere else it has happened.
Bayswater
Median house price: ~$1,190,000 Gross rental yield (houses): ~3.50% Median weekly rent: ~$800 12-month growth: ~17.7%
Bayswater is the most expensive suburb here. Its 17.7% over the year sits mid-table, behind Cannington, Midland, Gosnells, Ellenbrook and Armadale.
The upgraded station is now an interchange between the Midland Line and the Ellenbrook Line. That makes it one of the busier transit nodes in Perth. Bayswater is seven kilometres from the CBD, with heritage streets and the river. There is no capacity to build much more of it. Those are the conditions that hold a price up.
The yield is 3.50%. It will not come close to covering the loan, and nothing about Bayswater suggests it will improve, because the price is what keeps moving. This is a portfolio decision rather than a property decision. It works if you already hold yield elsewhere and what you now need is equity. Our strategy guide covers how to think about that balance.
Baldivis
Median house price: ~$843,500 Gross rental yield (houses): ~4.19% Median weekly rent: ~$680 12-month growth: ~16.5%
The thing to watch in Baldivis is supply.
It is a big masterplanned suburb about 42 kilometres south of the city on REIWA’s count. It has the things families move for, with several primary and secondary schools, shopping and sport. Tenants there tend to be families, and families tend to stay. Long tenancies mean less vacancy and fewer letting fees. At $843,500 and 4.19% it pays closer to Morley than to the yield suburbs. Its 16.5% over the past year is the softest on this list.
But Baldivis still has land. Where an established suburb answers new demand with a higher price, a growth suburb answers it with more houses. That caps the scarcity premium. It also makes street and product selection matter far more here than it does in Cannington or Morley.
Alkimos
Median house price: ~$840,000 Gross rental yield (houses): ~4.33% Median weekly rent: ~$700 12-month growth: ~16.6%
Alkimos got its station in July 2024 with the Yanchep Rail Extension. It came with about 700 parking bays, on what is now the Yanchep Line. The commute shortened considerably overnight.
It anchors the northern growth corridor running Butler, Alkimos, Eglinton, Yanchep. The City of Wanneroo added 7,531 residents in the year to June 2025, more than any other WA council on ABS figures. That is about as durable a demand driver as you can point at.
At $840,000 and 4.33% it prices alongside Ellenbrook and Baldivis, and it carries the same warning as Baldivis. New land releases can dilute rental demand if the builders get ahead of the people. Buy in the established pockets near the station where the amenities already exist, not out on the development fringe where they are still drawings.
The quick comparison
| Suburb | Median price | Yield | 12m growth | Key driver |
|---|---|---|---|---|
| Midland | ~$695,000 | ~4.86% | ~20.3% | New METRONET station, health campus |
| Armadale | ~$700,000 | ~4.68% | ~17.9% | Elevated rail, affordable entry |
| Gosnells | ~$760,000 | ~4.48% | ~20.0% | Armadale Line corridor, industrial |
| Cannington | ~$800,000 | ~4.88% | ~26.2% | Strategic centre, Carousel |
| Alkimos | ~$840,000 | ~4.33% | ~16.6% | Yanchep Rail Extension, northern corridor |
| Baldivis | ~$843,500 | ~4.19% | ~16.5% | Southern corridor, family demand |
| Ellenbrook | ~$850,000 | ~4.59% | ~18.9% | New Ellenbrook Line, family growth |
| Morley | ~$946,500 | ~4.12% | ~16.9% | New Morley Station, Galleria |
| Bayswater | ~$1,190,000 | ~3.50% | ~17.7% | Dual-line interchange, inner ring |
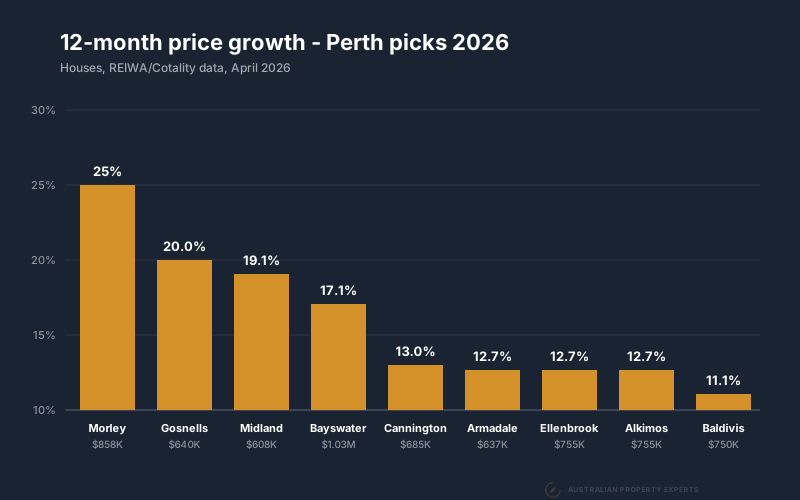
Which of these fits your position
The $495,000 gap between Midland and Bayswater is the whole point of the list. These are not nine versions of the same purchase ranked best to worst.
Say your borrowing capacity is tight and the property has to sit close to neutral from the first month. Then you are looking at Cannington at 4.88%, Midland at 4.86% or Armadale at 4.68%. Midland and Armadale both sit at or under $700,000. Gosnells misses that group at 4.48%, because its price outran the rent.
If you have the income to carry a shortfall and what the portfolio actually needs is equity, that is Morley, Bayswater and Ellenbrook. These are established suburbs with brand new rail. In Morley and Bayswater there is almost no room to build more of them.
Baldivis and Alkimos sit between the two, paying low fours with a population corridor behind them and more supply risk than anything else on the list.
Behind all of it is a state adding people at 2.1% a year, faster than any other state or territory. Rental supply has not kept up, with metro vacancy at 0.61%. METRONET is finished. That combination does not lift every suburb equally, which is the reason to be specific about which one you buy.
There is no best suburb here, only the one that suits your budget, your existing holdings and whether the next property needs to pay you or grow. If you are buying interstate, a buyers agent who knows Perth street by street is what separates the right side of a corridor from the wrong one. Our case studies show how that plays out on real purchases.
For the wider market picture including current medians, bank forecasts and infrastructure drivers, see our Perth property market 2026 update.
Figures refreshed 26 September 2026. Perth metro figures are Cotality’s Home Value Index at 31 August 2026. Suburb medians, rents and growth come from REIWA (12 months to August 2026) and CoreLogic via YIP (medians and growth to 30 June 2026, rents to 31 August 2026). For each suburb we show the lower-yielding of the two median and rent pairs, and the lower growth figure. Vacancy is SQM Research, August 2026.
This is general information only and not financial advice. Market data reflects conditions at time of writing and may have changed. Speak to a qualified professional before making investment decisions.
See how we buy high-growth, high-yield properties for clients.
If you want to talk through which Perth suburbs suit your budget and strategy, book a free discovery call.