The median Parramatta apartment sold for $695,000 in June 2016. In June 2026 it sold for $623,000. Over the same ten years the median Parramatta house went from $961,000 to $1,610,000.
Parramatta apartments did not have a bad year. They had a bad decade, and the reason for it is sitting on the approvals register.
What Parramatta apartments did
CoreLogic publishes an annual median for each suburb. Here is Parramatta, both property types, indexed so the two are comparable.
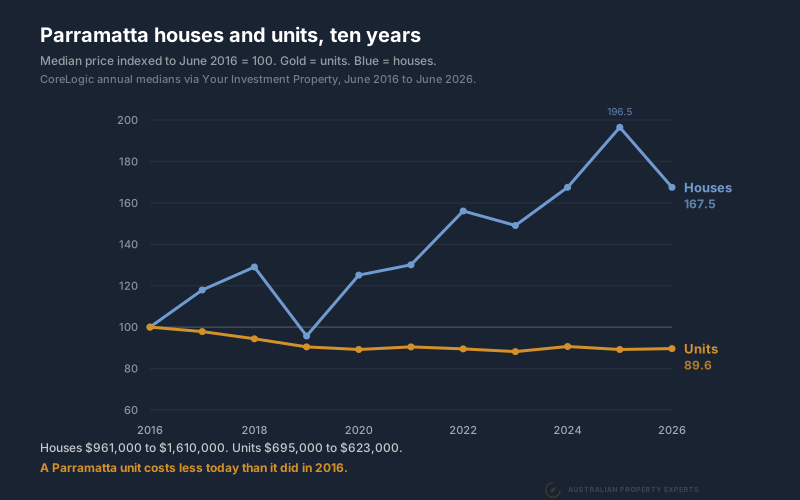
Houses finished the decade 67.5% higher, or 5.30% a year. Units finished 10.4% lower, or -1.09% a year. That is before inflation, before strata, before the stamp duty you paid on the way in.
It is not one suburb having a strange decade either. Every market in the Parramatta catchment shows a version of it.
| Suburb | Unit median 2016 | Unit median 2026 | 10 years | House, 10 years |
|---|---|---|---|---|
| Parramatta | $695,000 | $623,000 | -10.4% | +67.5% |
| Harris Park | $520,000 | $512,000 | -1.5% | thin sales |
| Westmead | $579,000 | $590,100 | +1.9% | +71.5% |
| Granville | $499,000 | $531,000 | +6.4% | +58.5% |
| North Parramatta | $562,000 | $694,500 | +23.6% | +79.7% |
North Parramatta is the best of the five and it still delivered less than a third of what its own houses did. Harris Park and Parramatta went backwards in nominal terms. Merrylands and Auburn next door tell the same story on a five year view, where they finished bottom of nine Sydney unit markets under $650,000.
Rents rose 45% while prices fell
The obvious explanation is that nobody wants to live in Parramatta. The rent says otherwise.
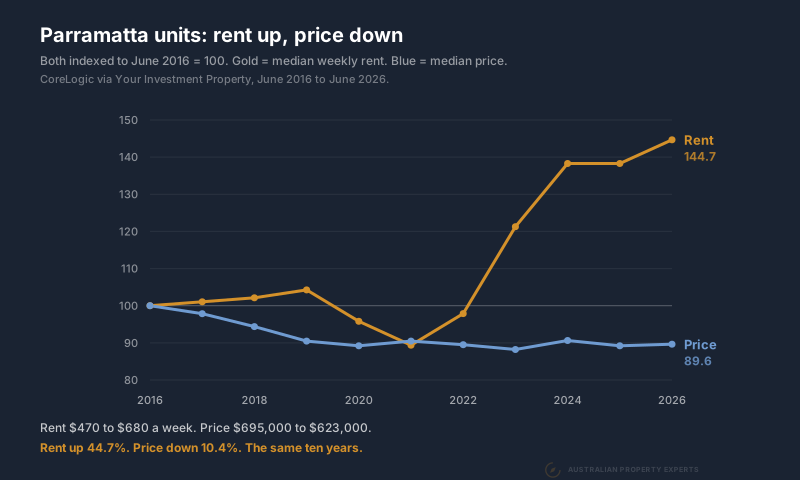
The median unit rent went from $470 a week to $680, up 44.7%. Tenant demand is not the problem. Parramatta is Sydney’s second CBD, it has Westmead next door, and people want to live there enough to pay half as much again in rent as they did in 2016.
That rent against that price is why the yield looks so good now. At $680 a week on a $623,000 median, a Parramatta unit computes to 5.68% gross. In 2016 the same arithmetic gave you 3.52%. The yield did not improve because Parramatta got better. It improved because the rent went up and the price did not, which is the same trap we found in Melbourne’s blue chip unit markets.
17,206 apartments, 2,610 houses
Here is the supply side, from the ABS building approvals data for the Parramatta SA3, which covers the CBD, Harris Park, Rosehill, North Parramatta and the Westmead end of Wentworthville.
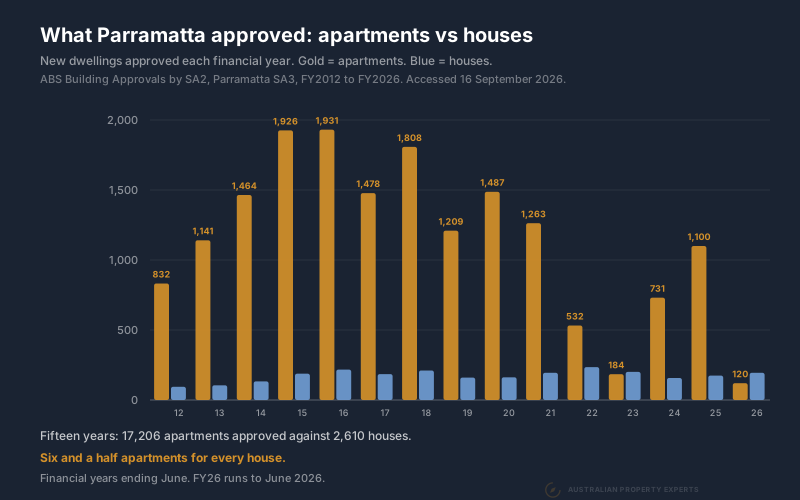
Fifteen years, 17,206 apartments and 2,610 houses. Apartments were 76% of every new home approved in that area once townhouses and semis are counted alongside the houses. Four financial years in the middle of the run, FY2015 through FY2018, put 7,143 apartments into the approval pipeline on their own.
That core is only part of the council area. Across the whole City of Parramatta LGA, approvals averaged 2,837 new dwellings a year over the eight years to June 2026, and 76% of those were apartments too. In FY2026 alone the LGA approved 2,020 of them.
Vacancy told you in 2019
New supply shows up in the rental market before it shows up in prices. SQM Research publishes vacancy by postcode, and 2150 has a clear record of what happened when the approvals of 2015 and 2016 turned into finished buildings.
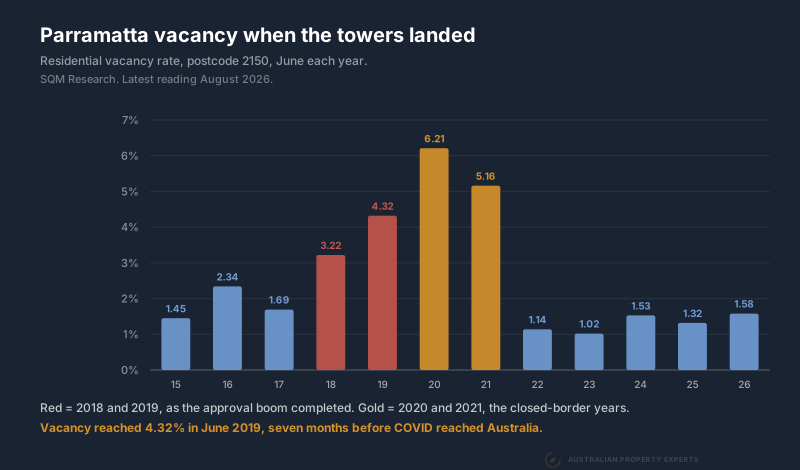
June 2019 hit 4.32%. That is seven months before Australia’s first COVID case, so the borders had nothing to do with it. The buildings approved three and four years earlier finished, the keys went to the market at once, and there were not enough tenants that month to take them.
Vacancy is back to 1.58% in June 2026 and 1.74% in August, which is a tight rental market by any measure. So the rent is up 45%, the vacancy is under 2%, and the price still has not moved.
Why apartment prices cannot run
Supply and demand set the price. The part most investors skip is that supply responds to price.
An established house in a corridor is protected by what it costs to replace it. Nobody can undercut you while land plus construction costs more than you paid, which is the whole argument for buying below replacement cost. Land is the scarce half of that sum and no planning decision creates more of it.
An apartment does not work that way. The land under a tower is divided by forty floors, so the land cost per dwelling is small and the rest is construction. More importantly, a rezoning manufactures dwellings. When a planning authority lifts a site from three storeys to thirty, the same piece of ground now produces ten times the homes, and the cost of producing one more of them barely moves.
That gives Parramatta apartments a supply curve that is close to flat at the feasibility price. Let prices rise far enough to make a tower stack up and towers get built, which puts the prices back. Let prices fall and construction stops, which does not help you either, because the stock already standing is what you are competing against when you sell. The adjustment happens in the number of apartments rather than in the price of them.
It also matters that apartments are close substitutes for each other in a way houses are not. A 2019 two bedroom on level 12 and a 2026 two bedroom on level 14 are the same product. A buyer choosing between them is comparing price alone. Two houses a street apart are never that interchangeable.
What is still coming to Parramatta
The pipeline ahead is bigger than the one that produced the last ten years.
- 19,500 new completed homes by 2029. That is the NSW housing target for City of Parramatta, against an existing 108,290 homes. An 18% increase in the total dwelling stock of the council area in five years. That is 3,900 completions a year, and the LGA has been approving 2,837 dwellings a year. Approvals are the bigger number of the two because not every approval gets built, so hitting the target means approving materially more than it does now.
- Up to 13,000 homes at Westmead South. The draft rezoning of the 125 hectare precinct went on exhibition until 16 September 2026, allows high rise of up to 38 storeys near the Metro station, and is expected to be finalised in 2027. Westmead South sits in the Cumberland council area, which carries a further 12,200 home target of its own, so these are 13,000 homes on top of Parramatta’s 19,500 and in the same rental catchment.
- 2,500 homes at Parramatta North, on a 42 hectare site alongside the light rail.
- 1,800 homes in the Church Street North precinct, rezoned to 30 storeys with effect from 1 July 2024.
- 470 apartments and 500 student rooms at the Metro station itself, proposed in September 2026 across four buildings including a 43 storey build to rent tower.
Sydney Metro West opens in 2032 and the infrastructure is real. The catch is that the same planning process delivering the station is also rezoning the land around it, and the second half of that arrives before the first.
Westmead has the same problem
Westmead is where investors push back hardest, because the health precinct genuinely is one of the largest in the country and the Metro station is coming.
Westmead units went from $579,000 to $590,100 over the decade. That is 1.9% in total, 0.19% a year. Westmead houses over the same ten years went from $1,166,000 to $2,000,000.
The hospital expansion, the research institutes and the students were all there for that entire decade. The demand story was true the whole time and it did not produce capital growth, because the response to it was 38 storey zoning rather than a price rise.
Same city, different supply
The cleanest test is another Sydney unit market that did not get the towers. Sutherland Shire has a 2029 housing target of 6,000 homes on a base of 91,110, which is 6.6% of its stock against Parramatta’s 18.0%.
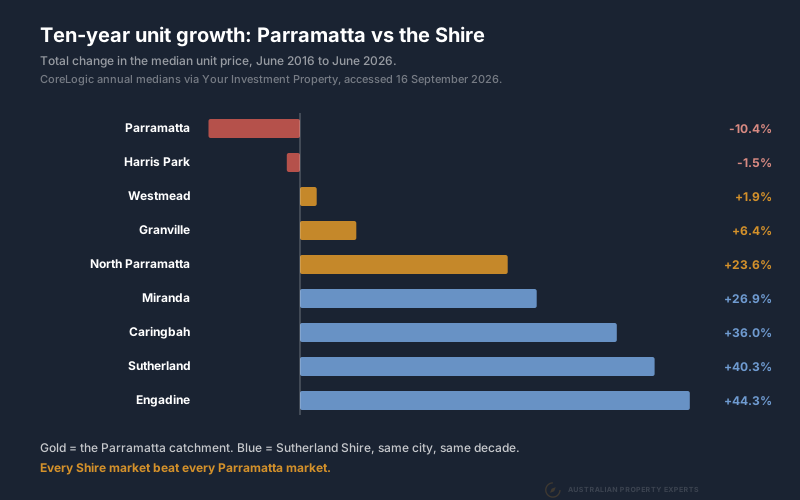
Nine markets, same city, same ten years, same interest rates. The four Shire markets took the top four places and the worst of them beat the best of the five Parramatta markets. What separates the two groups is how many new competing dwellings the planning system allowed in, not amenity or transport or jobs.
What this data does not prove
Two limits on the above.
These are medians, not index values. A median can drift down when the mix of what sells changes, and a decade of new one and two bedroom stock completing is exactly the kind of thing that shifts a mix. The rent series and the vacancy series are independent of that problem and they point the same way, but the price numbers carry the caveat.
Nine suburbs is also a small sample, and we picked the Shire because it is the obvious low supply comparison. Treat it as an illustration of the mechanism rather than a measured effect size.
When a Parramatta unit still works
We buy in Parramatta and we will keep buying there. What we will not do is buy an apartment in a tower and call it a growth asset.
A villa unit on its own title in a block of two to six, single storey with a courtyard, has a real land component and a small strata. It is not exposed to a thirty storey rezoning the way a tower apartment is, and it behaves much closer to a house than to an apartment even though the listing calls both of them units.
A tower apartment can still do a job if cash flow is the job. At 5.68% gross it services itself in a way a $1.6 million house on 2.40% never will, and there are portfolios where that is the piece that is missing. Just price it as an income asset and assume nothing from the capital, which is the trade-off we set out in growth versus yield. If you want the full comparison, we put houses and units side by side over thirty years in house or unit, and a buyers agent in Parramatta should be showing you the approvals pipeline for any building they put in front of you.
What ten years of supply did to price
Parramatta had the population growth, the infrastructure spend, the employment base and a rental market that pushed rents up 44.7%. Every demand ingredient an investor looks for was present for ten straight years, and the median apartment still finished lower than it started.
Demand was never the missing piece. Supply answered it every time, and ten flat years is what that answer looks like.
Data sources. Annual median prices and weekly rents are CoreLogic figures accessed through Your Investment Property, June 2016 to June 2026, pulled 16 September 2026. Yields are computed by us as weekly rent times 52 divided by the median. Dwelling approvals are ABS Building Approvals by SA2 and by LGA, financial years to June, accessed 16 September 2026. Vacancy rates are SQM Research for postcode 2150. Housing targets and rezoning figures are from the NSW Department of Planning, Housing and Infrastructure.
This is general information only and not financial advice. Speak to a qualified professional before making investment decisions.
If you are weighing a Parramatta apartment and want the approvals pipeline for that building before you commit, book a free discovery call.