Ipswich grew faster than any other council in Queensland in the year to June 2025. It added 9,138 residents, a 3.5% rise, on ABS figures. House prices across most of the city have more than doubled since 2021. To find the best suburbs to invest in Ipswich now, we tested all 31 suburbs with 50 or more house sales. Ten passed on price, yield and vacancy: North Booval, East Ipswich, Leichhardt, North Ipswich, Rosewood, Bundamba, Redbank Plains, Raceview, Redbank and Flinders View.
Their house medians run from $725,900 to $860,000. Gross yields of 3.69% to 4.08% beat the 3.3% Cotality average for Greater Brisbane houses. Rent won’t cover the loan interest on any of the ten, so these are growth buys you top up each week. The more affordable suburbs have grown the most. Of the 29 we could trace back to 2021, the 15 most affordable that year are up a median 144.4%, against 106.1% for the 14 dearest.
How we tested 31 Ipswich suburbs
We started with the 72 suburbs and localities in and around the City of Ipswich and pulled the house data for each. The figures are Cotality’s, formerly CoreLogic, published by Your Investment Property. Medians and sales cover the 12 months to 30 June 2026. Rents run to 31 August 2026. We worked out every yield as weekly rent times 52, divided by the median.
Thirty-one suburbs had 50 or more house sales. Below that, a single sale can move the median too far. Each then had to pass three tests.
- Price. A house median at or below $860,000, the median of the 31.
- Yield. A gross yield at or above 3.69%, also the median of the 31.
- Vacancy. Postcode vacancy at or below 0.75%, the Ipswich-wide rate in August 2026. We got that by adding up SQM Research’s figures for Ipswich’s seven main postcodes, 275 vacant rentals out of 36,518. Brisbane’s rate was 0.87%.
So a suburb had to be in the more affordable half on price and the higher-yielding half on yield. Its rental market also had to be tight. New building nearby has its own column in the table.
The 10 Ipswich suburbs that passed
The table is ordered by price. Vacancy is SQM’s August 2026 rate for the postcode, with August 2025 in brackets, so suburbs sharing a postcode share a figure. New houses per 100 is the number of new houses approved over the five years to June 2026 for every 100 there at the 2021 Census. It covers the ABS statistical area each suburb is in, which can take in its neighbours. A higher number means more new houses competing for tenants nearby.
| Suburb | House median | Gross yield | Vacancy | House sales | 1-yr price change | 5-yr price change | New houses per 100 |
|---|---|---|---|---|---|---|---|
| North Booval | $725,900 | 4.08% | 0.71% (0.77%) | 75 | +21.0% | +153.4% | 1.4 |
| East Ipswich | $740,000 | 4.01% | 0.62% (0.49%) | 55 | +20.8% | +129.8% | 1.4 |
| Leichhardt | $742,500 | 3.78% | 0.62% (0.49%) | 98 | +19.8% | +180.7% | 1.3 |
| North Ipswich | $757,648 | 3.84% | 0.62% (0.49%) | 100 | +12.2% | +131.7% | 1.8 |
| Rosewood | $780,000 | 3.87% | 0.28% (0.14%) | 89 | +13.9% | +151.6% | 27.7 |
| Bundamba | $789,999 | 3.82% | 0.71% (0.77%) | 124 | +23.2% | +146.1% | 9.0 |
| Redbank Plains | $830,000 | 3.77% | 0.64% (0.96%) | 519 | +18.6% | +140.6% | 15.5 |
| Raceview | $830,000 | 3.76% | 0.62% (0.49%) | 195 | +21.2% | +137.1% | 2.5 |
| Redbank | $845,000 | 3.69% | 0.64% (0.96%) | 51 | +21.4% | +131.5% | 27.8 |
| Flinders View | $860,000 | 3.75% | 0.62% (0.49%) | 103 | +16.2% | +116.4% | 2.5 |
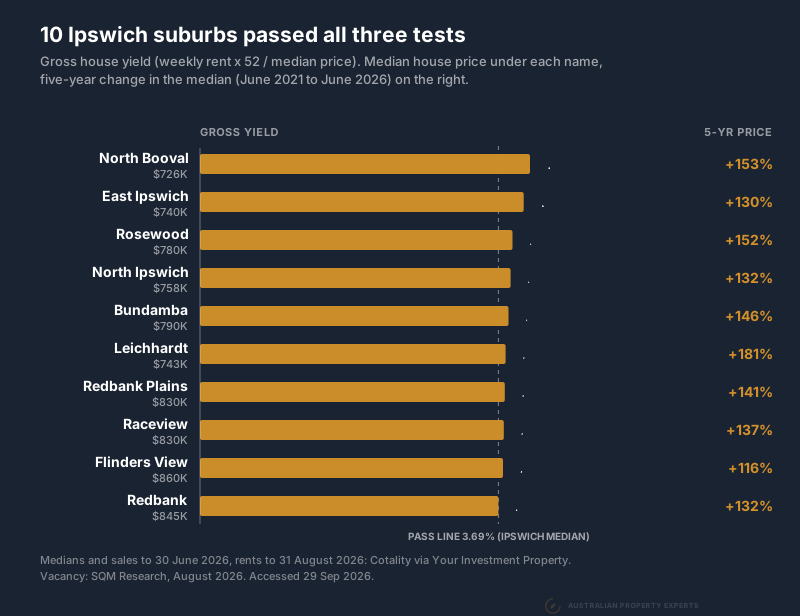
Redbank is exactly on the yield line and Flinders View exactly on the price line.
Affordable Ipswich suburbs grew the most
Leichhardt’s median was $264,500 in the year to June 2021 and $742,500 in the year to June 2026. North Booval went from $286,500 to $725,900. Most of Ipswich has a story like that.
We split the 29 at their June 2021 median of $397,500. The more affordable half pulled well clear, as the chart shows.
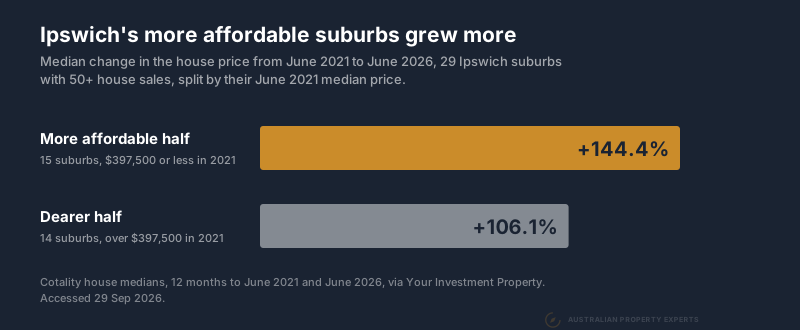
Suburbs with little new building before 2021 also grew more, and so did those with tight rental markets in 2021. Mostly they were the same older suburbs. Eleven of the 15 affordable suburbs also had little new building and tight rentals. Whichever one drove it, the growth went to the older, more affordable suburbs.
North Booval, Bundamba and East Ipswich
These three are east of the Ipswich CBD, close to the rail line into Brisbane. North Booval has the top yield of the ten, 4.08% on a $725,900 median and a $570 weekly rent. East Ipswich is next at 4.01%.
Bundamba is the busiest of the three, with 124 house sales. It grew 23.2% over the past year, the fastest of the ten. Rents keep climbing across the area. The typical North Booval rent is up 9.6% on a year ago, and East Ipswich’s is up 10.7%.
The ABS area covering North Booval and East Ipswich approved 87 new houses in five years, against 6,043 already there in 2021. That leaves tenants competing for older homes. North Booval and Bundamba were both badly hit in the 2022 flood, so in those two the street matters as much as the suburb.
North Ipswich and Leichhardt
North Ipswich is across the Bremer River from the CBD. Its $757,648 median, on 100 sales, yields 3.84%, and rents are up 12.0% in a year. The price is up 131.7% over five years, though last year’s rise was a gentler 12.2%.
Leichhardt, on the western side, yields 3.78% and has the biggest five-year gain in the table, at 180.7%. Both are in ABS areas that approved fewer than two new houses per 100 in five years.
Raceview and Flinders View
South of the CBD, Raceview had 195 house sales, second only to Redbank Plains on the list. Houses there sold in an average of 10 days over the year, as they did in Flinders View.
Raceview’s $830,000 median returns 3.76%, and it grew 21.2% over the year. Flinders View costs $860,000 and yields 3.75%. Its rents rose 12.7%, more than any other suburb on the list.
Redbank Plains and Redbank
On the Springfield side of Ipswich, closer to Brisbane, Redbank Plains is the biggest house market in the city. It recorded 519 sales in the year, far ahead of Springfield Lakes at 388. Redbank, next door, yields 3.69% and has its own station on the Ipswich line.
New supply is heavy here, as it is around Rosewood. The ABS area around Redbank approved 906 new houses in five years, or 27.8 for every 100 already there. The Redbank Plains area approved 988. Even so, vacancy in their postcode, 4301, fell from 0.96% to 0.64% over the year.
A short drive away, Mater’s new public hospital at Springfield has been fully open since May 2026, with 186 beds and almost 1,000 staff, according to Mater.
We’d buy the established houses here and leave the house-and-land packages to owner-occupiers. If an established house costs less than a new lot and build, the estates can’t easily undercut it, as we explain in why new estates don’t cap established prices.
Rosewood on Ipswich’s western edge
Rosewood is a country town inside the City of Ipswich, west of RAAF Base Amberley, with its own station at the end of the line from Ipswich. Its postcode had the lowest vacancy on the list in August, at 0.28%. Houses there have a $780,000 median on 89 sales and yield 3.87%.
Amberley is the Air Force’s largest base, with more than 5,000 people working there, according to Defence. The ABS area around Rosewood also takes in the newer estates towards Walloon and Thagoona, which helps explain its 27.7 new houses per 100. Those estates are in postcode 4306, where vacancy was 1.19%. Rosewood’s own postcode, 4340, had just two vacant rentals in August.
Ipswich suburbs that just missed
Seven more suburbs failed one test. Most missed on yield, and for the first three, a small lift in rent would be enough.
| Suburb | Missed on | Its figure | To pass |
|---|---|---|---|
| Brassall | Yield | 3.68% on $580 rent | Rent of about $583 |
| Booval | Yield | 3.64% on $550 rent | Rent of about $558 |
| Riverview | Yield | 3.56% on $505 rent | Rent of about $525 |
| Silkstone | Yield | 3.53% | Yield of 3.69% |
| Eastern Heights | Yield | 3.52% | Yield of 3.69% |
| Goodna | Vacancy | 0.86% | Vacancy of 0.75% |
| Collingwood Park | Price | $870,000 | Median of $860,000 |
Brassall is the closest call on yield. With 219 house sales, it is the fourth-busiest market in Ipswich. Goodna yields 3.87%, but its postcode vacancy is above the line. It was also the suburb hit hardest by the 2022 flood. Springfield Lakes, the second-busiest market in Ipswich, failed two tests, on its $930,000 price and the same 0.86% vacancy.
What to check before you buy in Ipswich
Flooding. The Bremer River flooded Ipswich in 2011 and again in 2022. Ipswich City Council’s review of the 2022 flood found more than 600 dwellings damaged across the city. The fire service’s damage assessment in that review rated 70 buildings in Goodna as severely damaged, 62 in Bundamba and 37 in North Booval. No other suburb had more than four. Check the address on the council’s flood mapping. Get an insurance quote before you make an offer.
New homes at Ripley. The Ripley Valley development area is planned for 48,750 homes and 131,000 people, according to Economic Development Queensland. The ABS area around Ripley approved 5,521 new houses in the five years to June 2026, more than the 4,149 houses there at the 2021 Census. That is almost half of new houses approved in the City of Ipswich. Postcode 4306, which covers Ripley, had Ipswich’s highest vacancy in August at 1.19%. None of the ten is in it.
More homes for sale. Stock is building. SQM counted 3,039 listings across Ipswich’s seven main postcodes in August 2026, against 1,885 a year earlier, a rise of 61%. Brisbane’s rose 26.5%. Cotality has Greater Brisbane house values up 10.3% over the year to August, but down 2.9% over the last three months. With more listings and softer values, buyers have more choice than a year ago. Our table’s price changes stop at June, so they miss most of that three-month fall. Check what has sold nearby since.
Cash flow. None of the ten reaches the 5.04% gross yield where rent covers the interest on an 80% loan at 6.3%. On North Booval’s $725,900 median, that interest comes to about $704 a week, against a $570 rent. The gap is about $134 a week before rates, insurance and management. What an investment property costs per week shows how to run the full numbers.
Where Ipswich fits in a portfolio
Ipswich has had five strong years. It has the fastest population growth of any council in Queensland, rising rents and older housing close to rail. It suits an investor buying for growth. Our capital growth vs rental yield guide covers that trade-off, and how much equity you need shows what it takes to fund the deposit.
Cairns suburbs yield 4.74% to 5.67% at medians of $550,000 to $740,000, so a house there is cheaper to hold, before insurance. Ballarat is cheaper to buy, with houses from $513,500. Our Brisbane suburb guide covers the Logan and Moreton Bay corridors. The Ipswich buyers agent page has the detail on how we work here.
Ipswich suburbs to shortlist in 2026
If yield comes first, start with North Booval and East Ipswich, and run the flood check on any North Booval address. For the tightest rental market, look at Rosewood, at 0.28% vacancy. Redbank Plains and Raceview have the most sales, 519 and 195. That means more choice and more recent sales to price against. North Booval, East Ipswich, Leichhardt and North Ipswich have the least new building nearby. Bundamba had the strongest year of the ten, up 23.2%.
Data sources. House medians, weekly rents, sales counts and days on market are Cotality (formerly CoreLogic) figures accessed through Your Investment Property. Medians and sales are to 30 June 2026 and rents to 31 August 2026. Every yield is computed by us as weekly rent times 52 divided by the median. Rent changes compare Cotality’s monthly median rent for August 2026 and August 2025. One-year and five-year changes compare the annual medians to June 2025, June 2021 and June 2026. New houses per 100 is ABS Building Approvals by SA2 for new houses, FY2022 to FY2026, divided by occupied separate houses at the 2021 Census. The supply comparison uses FY2017 to FY2021. Vacancy and listings are SQM Research by postcode for August 2026 and August 2025. The Ipswich rate is our sum of SQM’s figures for postcodes 4300, 4301, 4303, 4304, 4305, 4306 and 4340. Greater Brisbane values and yields are the Cotality Home Value Index to 31 August 2026. Population is ABS estimated resident population by council for June 2024 and June 2025. Flood figures are from Ipswich City Council’s review of the February to March 2022 flood. All figures pulled 29 September 2026.
This is general information only and not financial advice. Speak to a qualified professional before making investment decisions.
If you want an Ipswich house picked for growth and rising rents, book a free discovery call.