Most people work out what an investment property costs by comparing the rent to the repayment and hoping the two are close. In seven of Australia’s eight capital cities, they are not. The gap is bigger than almost anyone budgets for.
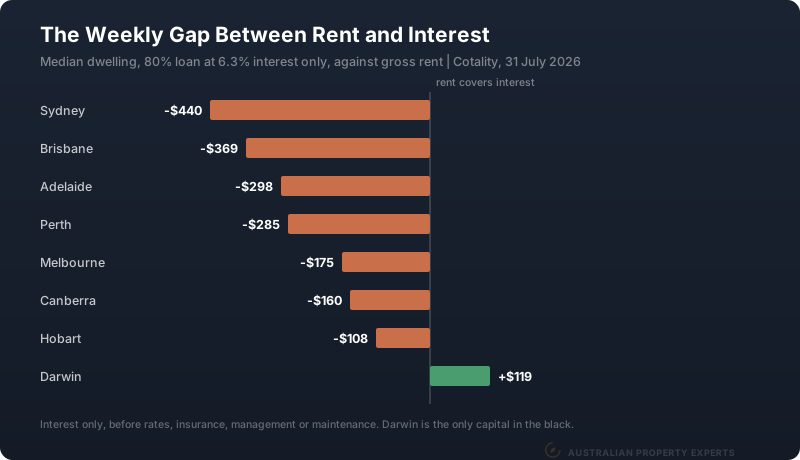
We modelled it on the median dwelling in every capital. The loan is 80% at 6.3%. We count only the interest, set against the gross rent that dwelling earns.
The weekly gap in every capital
| Capital | Median | Gross yield | Rent/wk | Interest/wk | Gap/wk | Gap/yr |
|---|---|---|---|---|---|---|
| Sydney | $1,222,718 | 3.3% | $776 | $1,185 | -$409 | -$21,275 |
| Brisbane | $1,080,142 | 3.4% | $706 | $1,047 | -$341 | -$17,714 |
| Adelaide | $937,207 | 3.6% | $649 | $908 | -$259 | -$13,496 |
| Perth | $999,987 | 3.9% | $750 | $969 | -$219 | -$11,400 |
| Melbourne | $786,718 | 4.0% | $605 | $763 | -$158 | -$8,182 |
| Canberra | $864,998 | 4.3% | $715 | $838 | -$123 | -$6,401 |
| Hobart | $752,397 | 4.4% | $637 | $729 | -$92 | -$4,815 |
| Darwin | $647,259 | 6.3% | $784 | $627 | +$157 | +$8,155 |
Medians and gross dwelling yields are from the Cotality Home Value Index at 31 August 2026. The 6.3% rate is the RBA’s average on new variable-rate investor loans at the large lenders in July 2026 (table F6).
Every figure above is interest only. Nothing for council rates, insurance, property management, letting fees, repairs or the weeks the place sits empty between tenants. Add those and every number gets worse, including Darwin’s.
It is also worth seeing the annual figures next to the deposit. A Sydney median at 80% means about $245,000 of your own money in. Then $21,275 a year goes out on top. Over five years that shortfall alone adds another $106,375 to what you have sunk into the property. None of it shows up in the purchase price you tell people.
The break-even yield is 5.04%
There is a single number underneath this table. At a 6.3% interest rate and an 80% loan, the gross yield you need for rent to cover interest is 5.04%. Anything below that and you are funding the shortfall from your salary every week. Of the eight capitals, exactly one clears it.
The number moves with the inputs. It moves fast. Borrow at 90% instead of 80% and you need 5.67%. If the rate drops to 5.5%, the bar falls to 4.4%. Darwin clears it easily. Hobart sits right on the line at 4.4%.
Work out your own version before you look at a single listing, because it tells you which markets can even work. Note that 5.04% only covers the interest. Take 30% off the rent for running costs and the bar rises to 7.2%. We work through that version in what is a good rental yield.
Why Sydney is the worst of them
Sydney has the biggest gap at $409 a week. Over a year that is $21,275 out of your take-home pay before a single expense. It gets there by combining the highest median in the country with the lowest yield at 3.3%.
That comes from a decade of prices rising faster than rents, and the owner carries the shortfall. Brisbane is now in similar territory at $341 a week, having run hard enough to compress its yield to 3.4%. Affordable markets cost less to buy and less to hold every week you own them.
What the tax refund covers
The shortfall is deductible today, so the real cost is lower than the table suggests. On a $120,000 income the marginal rate including Medicare is 32%. That turns Sydney’s $409 a week into about $278, and Melbourne’s $158 into $107.
That helps, but you only get roughly a third of the loss back.
What changes on 1 July 2027
From 1 July 2027, rental losses on established homes bought after 7:30pm on 12 May 2026 can no longer be offset against salary. They are quarantined, carried forward against future rental income or the eventual capital gain.
For the weekly cost, that means the after-tax column reverts to the pre-tax column. Sydney goes from about $278 a week back to $409. Across a year that is $6,808 more out of pocket on the same property, with nothing about the property having changed.
The loss is deferred, so you can still use it later. But deferred help does not pay this month’s shortfall. Serviceability is a cash-flow test. We covered the mechanics in the 2027 negative gearing and CGT changes. For established homes bought after 12 May 2026, yield decides whether you can afford to hold.
What to check before you buy
Run the interest test first. Gross yield against your actual rate and loan size. If the property fails it, you are buying a growth bet you have to fund weekly.
Budget the other costs. Rates, insurance, management, maintenance and vacancy all come out of gross rent before you see a dollar of it. Our cash flow calculator runs the full picture rather than the interest line alone.
Stress-test at a higher rate as well as today’s. The RBA has moved three times this year.
Check the yield is current. Yields compress when prices rise faster than rents. A figure from twelve months ago can overstate what you will collect.
Where this leaves the decision
Know the weekly number before you commit, and treat yield as a requirement rather than a bonus. A property that costs you $409 a week has to grow a long way just to pay you back for holding it.
The markets where the numbers work are mostly outside the capitals. Growth still matters as much as yield. Our note on growth versus rental yield covers why you need both rather than either.
Darwin was the only capital to clear the 5.04% bar, and the suburb data goes further. The best suburbs to invest in Darwin lists five that clear it with room to spare. Outside the capitals, Manoora in Cairns clears it at 5.67%, as our Cairns suburb guide shows.
This is general information only and not financial advice. The figures here are a model using published medians and yields, not a quote for any specific property. Speak to a qualified professional before making investment decisions.
If you want the weekly numbers run on a specific brief before you commit, book a free discovery call.