Investors compare stamp duty across states and stop there. Stamp duty hurts once. Land tax arrives every year you own the place, and over a normal hold it can dwarf the duty you agonised over at purchase.
So we ran the numbers. We took stamp duty at purchase plus ten years of land tax on the median dwelling in all eight capitals. The rate tables are the same ones that sit behind our calculators.
What we modelled
Each capital’s median dwelling value at 31 August 2026 (Cotality), bought by an individual investor, held ten years. Stamp duty comes from our stamp duty calculator and land tax from our land tax calculator. Both run 2026-27 rates, re-checked against the state revenue offices in September 2026.
Land tax is charged on land value, not the whole property. The model assumes land is 55% of the dwelling value. That assumption moves the totals, so we tested it at 40%, 50%, 60% and 70% as well. From 40% to 55% the order holds exactly. Above that, Brisbane crosses Queensland’s $600,000 threshold and climbs the table. The top and bottom never move.
Held flat at today’s rates, with no indexation and no land value growth. Real bills will be higher. This is about the gap between states, not a forecast.
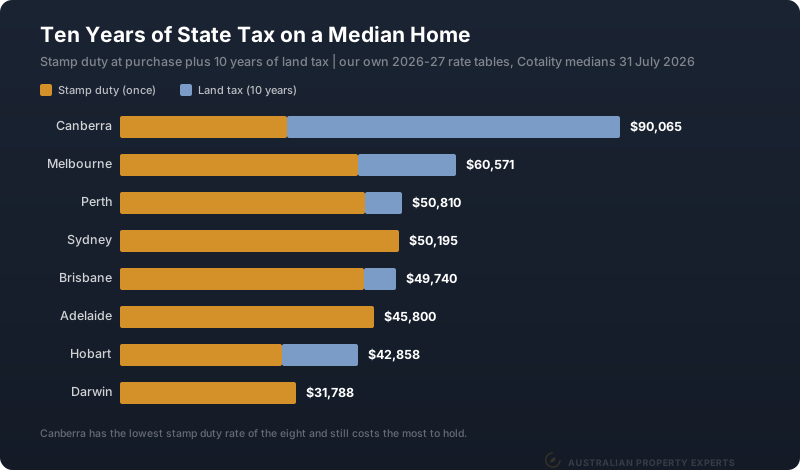
The ten-year cost in every capital
| Capital | Median | Stamp duty | Duty as % | Land tax, year 1 | Land tax, 10 yrs | Ten-year total |
|---|---|---|---|---|---|---|
| Canberra | $864,998 | $28,985 | 3.35% | $5,877 | $58,773 | $87,758 |
| Melbourne | $786,718 | $42,273 | 5.37% | $1,748 | $17,481 | $59,754 |
| Sydney | $1,222,718 | $49,209 | 4.02% | $0 | $0 | $49,209 |
| Perth | $999,987 | $42,616 | 4.26% | $625 | $6,250 | $48,866 |
| Adelaide | $937,207 | $45,382 | 4.84% | $0 | $0 | $45,382 |
| Brisbane | $1,080,142 | $42,637 | 3.95% | $0 | $0 | $42,637 |
| Hobart | $752,397 | $29,043 | 3.86% | $1,350 | $13,497 | $42,540 |
| Darwin | $647,259 | $32,039 | 4.95% | $0 | $0 | $32,039 |
The spread between the top and the bottom is $55,719 on a median purchase held for a decade.
Canberra: low duty to buy, dear to hold
Canberra has the lowest stamp duty rate of the eight at 3.35% and the highest total cost by a distance. At $87,758 it costs about $28,000 more than second-placed Melbourne and more than two and a half times Darwin.
The reason is the ACT’s tax design. In 2012 it began a 20-year program to abolish stamp duty, replacing the lost revenue through general rates. On top of that it charges land tax on every rented residential property from the first dollar of land value. No threshold. A fixed charge of $1,778 for 2026-27 plus a marginal rate, billed quarterly.
For an owner-occupier, who pays rates but no land tax, that trade makes sense. As an investor, you swap a one-off cost you can add to your loan for a recurring cost that comes out of rent every quarter for as long as you hold. It is the single biggest thing to model before you buy in the ACT. That is why we walk clients through the holding cost first when they ask us about a Canberra investment purchase.
The duty saving is real, but it is small and it goes quickly. Canberra’s $28,985 is $11,472 below the average duty of the other seven capitals. At $5,877 a year, the land tax eats that saving in under two years. Hold the full decade and the land tax alone comes to $58,773.
Why Sydney’s land tax bill is zero
Sydney has the highest median in the country and the biggest duty bill at $49,209. It still lands third, because its land tax comes to nothing at that median. NSW has the most generous threshold in the country at $1,075,000 of land value. A single median Sydney dwelling sits under it.
That is a threshold effect, not a permanent feature, and it is the part investors misread. Buy a second NSW property and the land values are added together against that one threshold. The second purchase can trigger a bill on the first. It is also why NSW freezing its thresholds from January 2025 matters more each year. Land values keep rising into a line that no longer moves.
Melbourne’s $50,000 threshold
Melbourne is the opposite case. It has the second-lowest median of the mainland capitals after Darwin and the highest duty rate in the model at 5.37%. Its land tax threshold is just $50,000. Almost any investment property clears that on day one.
That combination puts it second at $59,754. Victoria is the only state where an investor pays a top-tier duty rate on the way in and starts paying land tax immediately after.
What to check before you buy
Model your own land value, not ours. The 55% assumption is a modelling choice. Your rates notice carries the actual site value, and on an older house on a big block the land share runs higher, which pushes land tax up.
Count your existing holdings in that state. Every figure above is for a single property. Land tax aggregates within a state, so the marginal cost of your second purchase in the same state is usually far higher than the first. Our guide to reducing land tax across a portfolio covers how that compounds.
Check the entity. A discretionary trust pays land tax from the first dollar in NSW, from $25,000 in Victoria and South Australia, and from $350,000 in Queensland. The same trust is neutral in WA, Tasmania and the ACT. The structure that suits one state can be the expensive one next door.
Remember land tax is deductible. It comes off rental income, so the after-tax cost is lower than the headline. Stamp duty is not deductible. It goes into the cost base and reduces capital gains tax when you sell.
Where this changes the decision
This doesn’t mean buy in Darwin and avoid Canberra, because tax is only one cost. A market with no land tax and no growth will lose to a market with land tax and 6% growth every time. Growth and yield still decide the purchase.
What it does say is that comparing stamp duty alone gets the answer wrong, sometimes badly. The state with the lowest duty rate in the country is the most expensive place to own a property for a decade. When we compare markets for a client the holding cost goes in next to the yield, because it comes out of the same rent.
If you are weighing two states, run both through the stamp duty and land tax calculators with your own numbers before you decide. The state-by-state land tax breakdown has the thresholds behind these figures. For buying outside your home state, the interstate purchase guide covers the rest of the process.
This is general information only and not financial advice. Tax treatment depends on your circumstances and the figures here are a model, not a quote. Speak to a qualified professional before making investment decisions.
If you want the holding costs modelled on a specific brief before you commit to a state, book a free discovery call.