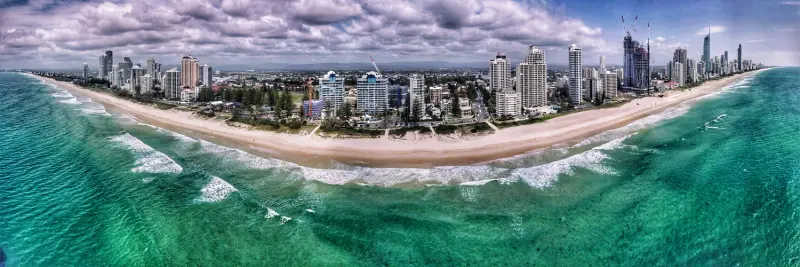
The Gold Coast rental market has pulled apart. In August 2026 Surfers Paradise recorded 4.2% vacancy while Beenleigh and Eagleby, up the northern corridor, sat at 0.6%. That is two markets going in opposite directions. The gap between them decides where a Gold Coast purchase makes sense right now.
Gold Coast vacancy rates by postcode
Vacancy is the number that has moved most. It has also moved unevenly. These are SQM Research figures for August 2026, with March 2026 for comparison.
| Postcode | Area | Aug 2026 | Mar 2026 |
|---|---|---|---|
| 4217 | Surfers Paradise | 4.2% | 2.7% |
| 4220 | Burleigh Heads | 2.8% | 1.9% |
| 4226 | Robina | 1.1% | 0.6% |
| 4214 | Ashmore | 1.3% | 0.7% |
| 4227 | Varsity Lakes | 0.8% | 0.7% |
| 4207 | Beenleigh, Eagleby | 0.6% | 0.5% |
Surfers Paradise has gone from 2.7% to 4.2% in five months. It is now above where it sat a year ago. Robina has nearly doubled off a low base. The northern end has barely moved.
At 4% vacancy a landlord has to compete for tenants, while at 0.6% tenants are competing for the property. On a Surfers Paradise house renting at $1,265 a week, a few extra weeks empty each year is real money.
What the Gold Coast is worth
Cotality does not publish a separate Gold Coast index, because the city sits inside its Regional Queensland series. Anyone quoting you a single Gold Coast median is inferring it.
Regional Queensland as a whole had a median of $844,803 at 31 August 2026, up 9.1% over the year but down 0.5% in August. It peaked in May 2026 and sits 1.3% below that peak. Gross yield across the region is 4.2%.
Nationally, values peaked in March 2026 and have fallen five consecutive months. They now sit 3.6% below that peak. The RBA has raised rates four times in 2026, most recently to 4.60% on 29 September.
The other south-east Queensland coastal market runs dearer again. On the Sunshine Coast, Buderim’s median house is $1,402,500 and Maroochydore’s $1,250,000, both computing yields near 3.5%. Nambour is the affordable end at $890,000 and 3.97%.
Gold Coast house prices by suburb
Suburb figures do get published. They show the same split as the vacancy table. Growth below covers the twelve months to June 2026. That captures the boom and ends just after the turn.
| Suburb | Median | 12m growth | Rent | Yield |
|---|---|---|---|---|
| Eagleby | $805,000 | +18.38% | $580 | 3.75% |
| Beenleigh | $850,000 | +21.43% | $610 | 3.73% |
| Pimpama | $995,000 | +17.06% | $770 | 4.02% |
| Coomera | $1,050,000 | +17.19% | $800 | 3.96% |
| Robina | $1,426,500 | +9.14% | $1,050 | 3.83% |
| Burleigh Heads | $1,900,000 | +35.71% | $1,300 | 3.56% |
| Surfers Paradise | $1,727,500 | +47.65% | $1,265 | 3.81% |
Yields above are calculated from the median and the median rent in the same row, so they reconcile. Published yield figures for these suburbs are drawn to a later date than the medians and do not.
The yield column barely moves, which many investors don’t expect. Every suburb here returns between 3.56% and 4.02%, a spread of less than half a percentage point. That holds from an $805,000 house in Eagleby to a $1.9 million one in Burleigh Heads.
On the Gold Coast, paying more does not buy you a better yield, and paying less does not cost you one. Eagleby at $805,000 returns about a fifth of a point more than Burleigh Heads at $1,900,000.
So the choice comes down to the vacancy behind that yield, and how much capital you have to put at risk to collect it. Surfers and Burleigh also posted the biggest growth over the year to June, which is what a late-cycle market looks like. The premium end runs last. It is also the end now showing 4.2% and 2.8% vacancy.
Where the units sit
Units make up much of the Gold Coast’s stock, and their yields are higher than the houses’. Surfers Paradise units run an $820,000 median at $770 a week, a 4.88% gross yield. That is a full percentage point above the houses around them.
Those yields look attractive next to the houses. On a beachfront apartment, that extra yield is paying you for holiday-let competition, body corporate costs and a vacancy rate now at 4.2%. Our note on houses versus units covers where that trade makes sense.
What to weigh up before buying
The difference in vacancy between these suburbs matters more than anything else here. Surfers Paradise at 4.2% and Beenleigh at 0.6% are not the same investment, whatever the postcode prefix suggests.
The growth figures are history. They run to June 2026. Regional Queensland peaked the month before and is now falling, so treat those numbers as where demand was.
House yields sit below the 4.60% cash rate. At 3.56% to 4.02%, a Gold Coast house purchase leans on growth in a market that has just turned. That means growth and yield both have to work.
Tourism adds two risks at the beachfront end. Beachfront stock faces the most competition from short-stay rentals. It is also the most exposed to discretionary spending, which is the first thing to go when rates stay high.
Where this leaves a Gold Coast brief
The Gold Coast still has a case. You find it at the northern end rather than on the beach. Coomera, Pimpama, Beenleigh and Eagleby offer entry between $805,000 and $1.05 million on a yield as good as the beachfront pays. Beenleigh and Eagleby were renting at 0.6% vacancy in August.
The beachfront is the opposite trade. You pay roughly double the price for no better yield, in a rental market loosening quickly. Our Gold Coast buyers agent page sets out the suburbs we buy in and why.
This is general information only and not financial advice. Speak to a qualified professional before making investment decisions.
If you want a Gold Coast brief built on current vacancy rather than last year’s growth, book a free discovery call.
Sources
- Postcode vacancy rates: SQM Research, August 2026 with March 2026 comparison
- Suburb medians, growth, yields and rents: Your Investment Property, CoreLogic data, medians and growth for the twelve months to 30 June 2026, rents at 31 August 2026
- Regional Queensland median, growth and yield, plus national values and peak dates: Cotality Home Value Index, September 2026 release, index results as at 31 August 2026
- Cash rate: RBA monetary policy decision, 29 September 2026, raised to 4.60% (RBA cash rate)
- Note: Cotality does not publish a standalone Gold Coast index. The city is reported within Regional Queensland