Regional Australia is where some of the strongest investment fundamentals sit right now. Entry prices are lower and yields are higher. There is also infrastructure spending that hasn’t been priced in yet.
One thing has changed since this was first published. Vacancy in six of the ten markets below is higher now than it was in March.
Geraldton doubled, from 0.43% to 0.86%, in the same year its prices rose 29.11%. Most of these markets are still tight in absolute terms. It is the direction that has turned. A decision made on the March readings is built on something that no longer holds.
Here are 10 regional markets we’re watching closely in 2026, with current data on each.
How we assess regional markets
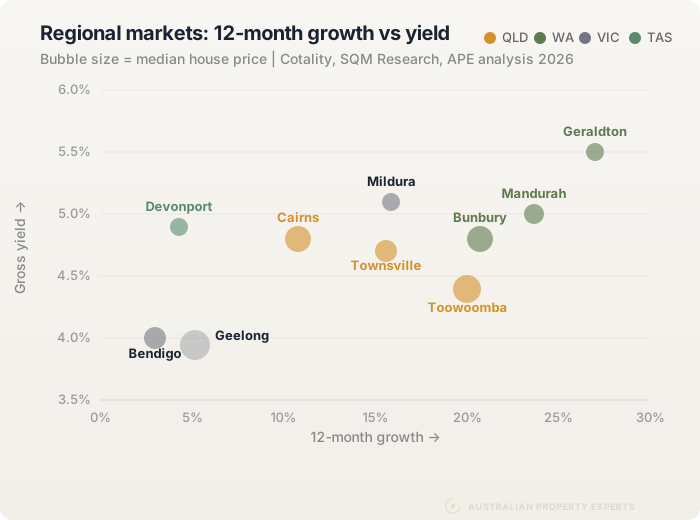
Every market gets scored across five factors: median price and entry point, gross rental yield, vacancy rate, infrastructure pipeline and employment diversity. A market that’s strong on yield but weak on employment diversity is a different proposition to one that delivers both. For a deeper look at how growth and yield work together in a portfolio, see our guide to capital growth vs rental yield.
Every yield here is weekly rent times 52 divided by the median. It is computed from the two figures in each block so you can check it. We don’t use published yield columns. They draw the rent and the median from different months, so they don’t reconcile against the prices sitting beside them.
Each market is represented by one of its highest-volume suburbs, with the sales count beside it. That way you can see the basket is a real market rather than a handful of trades. A regional city’s CBD suburb is usually thin. We don’t use it here.
Cairns, QLD
Volume suburb: Edmonton, 177 sales Median house price: $734,400 Median weekly rent: $670 Gross rental yield (houses): 4.74% 12-month growth: +21.52% 5-year average growth: +15.01% Days on market: 11 Vacancy rate: 0.55% in August 2026, from 1.04% in March
Cairns has been one of the strongest regional performers in Queensland. Edmonton, one of the two busiest suburbs by sales, is up 21.52% over the year on a five-year average of 15.01%. Houses are moving in 11 days.
It is also one of three markets on this list where vacancy eased rather than rose. Vacancy went from 1.04% in March to 0.55% in August. That is now the tightest reading of the ten, back under 1% after sitting above it in March.
The infrastructure pipeline is significant. A $1 billion expansion of Cairns Hospital is funded. Construction is expected to commence in late 2026, with Stage 1 due in 2031. The airport is also undergoing a $60 million Eastern Aviation Precinct development. Both projects create construction jobs in the short term and permanent employment growth longer term.
The rest of the market reads the same. Mount Sheridan is at 4.78% on a $740,000 median across 178 sales. Bentley Park is 4.85% on $728,470 across 158. Trinity Beach sits at 4.53% on $890,000 and Manunda 4.86% on $696,000.
Beyond tourism, the health and education sectors are growing. That broadens the employment base and reduces single-industry dependency. See our Cairns buyers agent page for more on this market. Our Cairns suburb guide tests all 18 Cairns suburbs with 50 or more house sales on price, yield and vacancy.
Townsville, QLD
Volume suburb: Kirwan, 417 sales Median house price: $655,000 Median weekly rent: $578 Gross rental yield (houses): 4.59% 12-month growth: +16.96% 5-year average growth: +14.76% Days on market: 16 Vacancy rate: 0.71% in August 2026, from 0.70% in March
Townsville has a deep infrastructure pipeline behind it. CopperString alone carries a record $3.2 billion state commitment in the 2026-27 Budget. It is the biggest energy project in North Queensland’s history. The line runs from Townsville to Mount Isa, with the Eastern Link due by 2032.
Beyond CopperString, Lavarack Barracks and RAAF Base Townsville hold more than 4,500 ADF personnel, with another 500 posted there from 2025. That level of government investment creates sustained employment. Jobs are the fundamental driver of property demand.
At 0.71% Townsville’s vacancy sits mid-pack of these ten. It has barely moved from 0.70% in March. Kirwan is the second-deepest market here too, with 417 house sales in the year, behind only Mildura.
The market runs wider than one suburb. Kelso is at 4.77% on a $600,000 median across 256 sales. Deeragun is 4.47% on $640,000 across 103, and Annandale 4.28% on $765,500 across 149. Entry prices are still reasonable relative to the yield and growth combination. See our Townsville buyers agent page for more on this market, and our Central Queensland market breakdown for the four centres further south.
Toowoomba, QLD
Volume suburb: Newtown, 226 sales Median house price: $720,000 Median weekly rent: $550 Gross rental yield (houses): 3.97% 12-month growth: +20.00% 5-year average growth: +17.06% Days on market: 10 Vacancy rate: 0.58% in August 2026, from 0.59% in March
Toowoomba sits west of Brisbane. Inland Rail was meant to run through Toowoomba. In May 2026 the federal government stopped funding the line north of Parkes, so we give it no weight here.
The entry point is no longer the discount it once was. Newtown’s $720,000 median sits just under Edmonton in Cairns at $734,400. At 3.97% the yield is the second-lowest of these ten, above only Geelong. What Toowoomba has is growth. It rose 20.00% over the year, fourth of the ten, on the third-highest five-year average here at 17.06%.
Vacancy barely moved, from 0.59% in March to 0.58% in August. Toowoomba is one of the three markets here where it eased. Houses are selling in 10 days. The employment base is diverse across health, education, agriculture and logistics. Population growth has been steady.
The wider market sits in the same band. Harristown is at 4.01% on a $740,000 median across 165 sales. Wilsonton is 3.84% on $745,000, Centenary Heights 3.76% on $830,000 and Kearneys Spring 3.83% on $815,000. See our beginner’s guide for what to look for in your first purchase, and our Toowoomba buyers agent page for more on this market.
Geraldton, WA
Volume suburb: Spalding, 72 sales Median house price: $510,000 Median weekly rent: $500 Gross rental yield (houses): 5.10% 12-month growth: +29.11% 5-year average growth: +24.21% Days on market: 10 Vacancy rate: 0.86% in August 2026, from 0.43% in March
Geraldton leads this list on four counts. It has the highest yield at 5.10%, the highest 12-month growth at 29.11% and the highest five-year average at 24.21%. It also has the lowest entry price, at a $510,000 median. Sales are the fastest too, at 10 days, tied with Toowoomba.
The catch is depth and direction. Spalding’s 72 sales are the smallest basket of the ten markets here. Wonthella, the other Geraldton suburb worth a look, ran 43 sales at a $520,000 median and 5.30%. Vacancy doubled between March and August, from 0.43% to 0.86%, in the same year prices rose 29.11%.
The risk with Geraldton is that it’s a smaller market with less employment diversity than the larger regional centres. Mining and agriculture are the primary drivers. If commodity prices soften, demand can ease quickly.
Geraldton has been both a yield market and a growth market this year. It wasn’t last time we wrote this up. The mistake is buying it expecting another 29.11%. See our Geraldton buyers agent page for more on this market.
Bunbury, WA
Volume suburb: Australind, 299 sales Median house price: $775,000 Median weekly rent: $680 Gross rental yield (houses): 4.56% 12-month growth: +19.23% 5-year average growth: +15.53% Days on market: 11 Vacancy rate: 1.14% in August 2026, from 0.75% in March
Bunbury is the largest regional centre in WA’s south-west. It has seen steady growth off the back of Perth’s broader market expansion.
The figures above are Australind rather than Bunbury itself, because Australind is where the volume is. It ran 299 house sales in the year against 74 in Bunbury suburb. That $775,000 median is the highest of the ten markets on this page. Bunbury suburb is dearer at $822,500 and 4.11%. Eaton sits at 4.66% on $725,000 across 164 sales, and Carey Park at 5.03% on $600,000 across 123.
Australind’s vacancy rose between March and August, from 0.75% to 1.14%. Postcode 6230, which covers Bunbury itself, went the other way and eased to 0.63% from 0.79%. Which figure applies depends on which of the two you buy in. Don’t read them as one market.
The employment base is more diversified than smaller WA regional towns, with health, education, retail and mining services all contributing.
The entry point is higher than Geraldton, but the market is far deeper, at 299 sales against Spalding’s 72. For interstate investors looking at WA, Bunbury offers a more balanced risk profile than the smaller mining-adjacent towns. See our Bunbury buyers agent page for more on this market.
Mandurah, WA
Volume suburb: Mandurah, 290 sales Median house price: $643,250 Median weekly rent: $570 Gross rental yield (houses): 4.61% 12-month growth: +16.95% 5-year average growth: +17.68% Days on market: 11 Vacancy rate: 1.38% in August 2026, from 1.18% in March
Mandurah, south of Perth, has the second-highest five-year average on this list at 17.68%, behind only Geraldton. The past 12 months have been quieter at 16.95%. That is the second-lowest 12-month figure of the ten. Properties still move in 11 days on average.
A 4.61% yield with 16.95% capital growth still makes for a strong total return, but the rent is doing less of the work than it was. Vacancy has moved from 1.18% in March to 1.38% in August. The rental market here is loosening rather than tightening.
Mandurah benefits from proximity to Perth, lifestyle appeal and relatively affordable entry compared to Perth metro suburbs. See our Mandurah buyers agent page for more on this market.
Bendigo, VIC
Volume suburb: Golden Square, 225 sales Median house price: $605,000 Median weekly rent: $520 Gross rental yield (houses): 4.47% 12-month growth: +11.01% 5-year average growth: +6.99% Days on market: 20 Vacancy rate: 0.57% in August 2026, from 0.47% in March
Bendigo is one of Victoria’s key regional centres, north-west of Melbourne. Its rental market is the second-tightest here at 0.57%, behind Cairns. That has risen from 0.47% in March, though.
Growth is the softest on this page. The 11.01% over 12 months and the 6.99% five-year average are both the lowest of the ten. At 20 days, Bendigo houses also take the longest to sell. The yield isn’t the problem. At 4.47% it sits ahead of both Toowoomba and Geelong.
The employment base is diverse across health (Bendigo Health is a major employer), education, retail and government services. The suburbs read consistently. Kangaroo Flat is at 4.56% on a $605,000 median across 209 sales and Eaglehawk 4.50% on $595,000 across 119. Long Gully sits at 4.56% on $547,500 and Flora Hill at 4.30% on $592,000.
The entry point is reasonable and the fundamentals are stable. Bendigo is more of a steady, long-term hold than a high-growth play. See our Bendigo buyers agent page for more on this market.
Geelong, VIC
Volume suburb: Corio, 382 sales Median house price: $585,000 Median weekly rent: $440 Gross rental yield (houses): 3.91% 12-month growth: +18.18% 5-year average growth: +7.11% Days on market: 15 Vacancy rate: 1.48% in August 2026, from 0.79% in March
Geelong is the largest regional city in Victoria. It trades as two markets. Corio, one of its busiest suburbs with 382 sales, has a $585,000 median. Belmont, at the established end, is $745,000 on a 3.70% yield, the lowest of any suburb named on this page.
Geelong yields sit at the bottom here. Corio at 3.91% is the lowest of the ten. The rest of Geelong sits close to it. Norlane is at 4.00% on a $532,500 median across 250 sales, Whittington 4.07% on $600,000 and Newcomb 4.00% on $630,000.
The South Geelong to Waurn Ponds rail duplication was finished in August 2024. The broader Geelong Fast Rail project lost its federal funding in the November 2023 infrastructure review and was cancelled.
Vacancy nearly doubled between March and August, from 0.79% to 1.48%, the biggest rise on this page. The five-year average of 7.11% is the second-lowest here, ahead of only Bendigo. The past 12 months, at 18.18%, have been much stronger. A market running hard off a slow five years while its rental side eases is one to price carefully.
Corio’s entry point now sits in the lower half of this list. That changes who Geelong suits. It reads as a growth-led hold close to Melbourne rather than a yield buy. See our Geelong buyers agent page for more on this market.
Mildura, VIC
Volume suburb: Mildura, 844 sales Median house price: $561,550 Median weekly rent: $520 Gross rental yield (houses): 4.82% 12-month growth: +18.22% 5-year average growth: +9.92% Days on market: 15 Vacancy rate: 1.44% in August 2026, from 1.46% in March
Mildura is the deepest market on this page by a wide margin. It ran 844 house sales in 12 months, more than double the next one. Its 4.82% yield is the second-highest of the ten behind Geraldton, on the second-lowest median at $561,550. Growth of 18.22% over the year puts it sixth.
It also has the second-loosest vacancy here, at 1.44% in August against 1.46% in March. That is still a tight rental market in absolute terms. It is one of the three markets on this page where vacancy eased, if only slightly.
The economy is driven by agriculture, food processing, tourism and health. Employment diversity is reasonable for a regional centre of its size. Population growth is steady.
Red Cliffs runs a higher yield again at 5.39% on a $443,750 median across 96 sales, with 12.34% growth. For investors looking at how growth and yield work together, Mildura is one of the stronger regional examples in Victoria. We compare it against Shepparton, Warrnambool and Wodonga in our regional Victoria market breakdown. Our Mildura buyers agent page covers how we buy there.
Devonport, TAS
Volume suburb: Devonport, 268 sales Median house price: $585,000 Median weekly rent: $530 Gross rental yield (houses): 4.71% 12-month growth: +20.62% 5-year average growth: +10.76% Days on market: 13 Vacancy rate: 0.66% in August 2026, from 0.51% in March
Devonport sits in the lower half of this list on price at a $585,000 median and returns 4.71%. Vacancy is 0.66%, the fourth-tightest of the ten, though it has risen from 0.51% in March.
Growth has run at 20.62% over the past year, ahead of both Townsville and Mandurah. The Spirit Quay terminal redevelopment and two new ships, with Spirit of Tasmania IV launching in October 2026, add further demand. Launceston, to the east, runs on a bigger base. Our Launceston market analysis sets it out. See our Devonport buyers agent page for more on this market.
East Devonport is the higher-yield side of town at 5.10% on a $530,000 median, with 19.10% growth across 68 sales.
The tradeoff is market depth. 268 sales is mid-pack for this list but thin against a capital city, so it can take longer to sell when you need to. For buy-and-hold investors, this isn’t a concern. For anyone who might need to exit within 3-5 years, the smaller market adds risk.
The quick comparison
| Market | Suburb | Median | Rent/wk | Yield | 12m growth | 5yr avg | Sales (12m) | Days on market | Vacancy Aug 2026 (Mar 2026) |
|---|---|---|---|---|---|---|---|---|---|
| Cairns, QLD | Edmonton | $734,400 | $670 | 4.74% | +21.52% | +15.01% | 177 | 11 | 0.55% (1.04%) |
| Townsville, QLD | Kirwan | $655,000 | $578 | 4.59% | +16.96% | +14.76% | 417 | 16 | 0.71% (0.70%) |
| Toowoomba, QLD | Newtown | $720,000 | $550 | 3.97% | +20.00% | +17.06% | 226 | 10 | 0.58% (0.59%) |
| Geraldton, WA | Spalding | $510,000 | $500 | 5.10% | +29.11% | +24.21% | 72 | 10 | 0.86% (0.43%) |
| Bunbury, WA | Australind | $775,000 | $680 | 4.56% | +19.23% | +15.53% | 299 | 11 | 1.14% (0.75%) |
| Mandurah, WA | Mandurah | $643,250 | $570 | 4.61% | +16.95% | +17.68% | 290 | 11 | 1.38% (1.18%) |
| Bendigo, VIC | Golden Square | $605,000 | $520 | 4.47% | +11.01% | +6.99% | 225 | 20 | 0.57% (0.47%) |
| Geelong, VIC | Corio | $585,000 | $440 | 3.91% | +18.18% | +7.11% | 382 | 15 | 1.48% (0.79%) |
| Mildura, VIC | Mildura | $561,550 | $520 | 4.82% | +18.22% | +9.92% | 844 | 15 | 1.44% (1.46%) |
| Devonport, TAS | Devonport | $585,000 | $530 | 4.71% | +20.62% | +10.76% | 268 | 13 | 0.66% (0.51%) |
Vacancy rose in six of these ten markets between March and August 2026. Townsville was flat, and Cairns, Toowoomba and Mildura eased. Each vacancy figure is for the listed suburb’s postcode. Bunbury’s row is Australind, postcode 6233, because that is where the volume is. Bunbury’s own postcode, 6230, read 0.63% in August against 0.79% in March.
What this data tells you
The strongest yield-to-price ratios are in WA (Geraldton) and regional Victoria (Mildura). The strongest infrastructure pipelines are in North Queensland (Townsville, Cairns). The most balanced profiles, combining yield, growth, employment diversity and market depth, sit with Townsville, Mildura and Mandurah.
The point to carry out of this refresh is direction. Six of these ten rental markets loosened between March and August, and Townsville held flat.
None of them is loose in absolute terms. Geelong, the loosest here at 1.48%, is still a landlord’s market. But the tightening trend that made regional yields work is no longer running one way.
No single market ticks every box. The right one depends on your budget, your strategy and where your existing portfolio sits. A growth-heavy portfolio needs a yield property to balance holding costs. A cash-flow portfolio needs a growth asset to build equity for the next purchase.
Regional markets reward investors who do the research and avoid the hype. The data is publicly available. Cross-referencing it, understanding local drivers and knowing which streets within a suburb to buy on requires deeper work. The results are on our case studies page.
For suburb-level breakdowns on specific regional markets, see our guides on Hobart, Newcastle, and Townsville.
Data sources. Medians, growth, sales volumes and days on market are CoreLogic via Your Investment Property, 12 months to 30 June 2026. Weekly rents are to 31 August 2026. Vacancy rates are SQM Research by postcode, August 2026, with the March 2026 reading shown alongside. Every yield on this page is computed by us as weekly rent times 52 divided by the median. We don’t use published yield columns, because they draw the rent and the median from different months and so don’t reconcile against the prices shown. All figures pulled 26 September 2026.
This is general information only and not financial advice. Market data reflects conditions at time of writing and may have changed. Speak to a qualified professional before making investment decisions.
See how we buy in regional markets for investors.
If you want to discuss which regional markets suit your budget and strategy, book a free discovery call.