To find the best Sydney suburbs to buy units in 2026, we tested every established unit market in the city. Twelve passed all six tests. Ten of them are where we would start looking: Mount Druitt, Wiley Park, Lakemba, Punchbowl, Bankstown, Belmore, Riverwood, Campsie, North Parramatta and Hornsby. Asquith and Northmead also pass, but both rose less than 10% in five years.
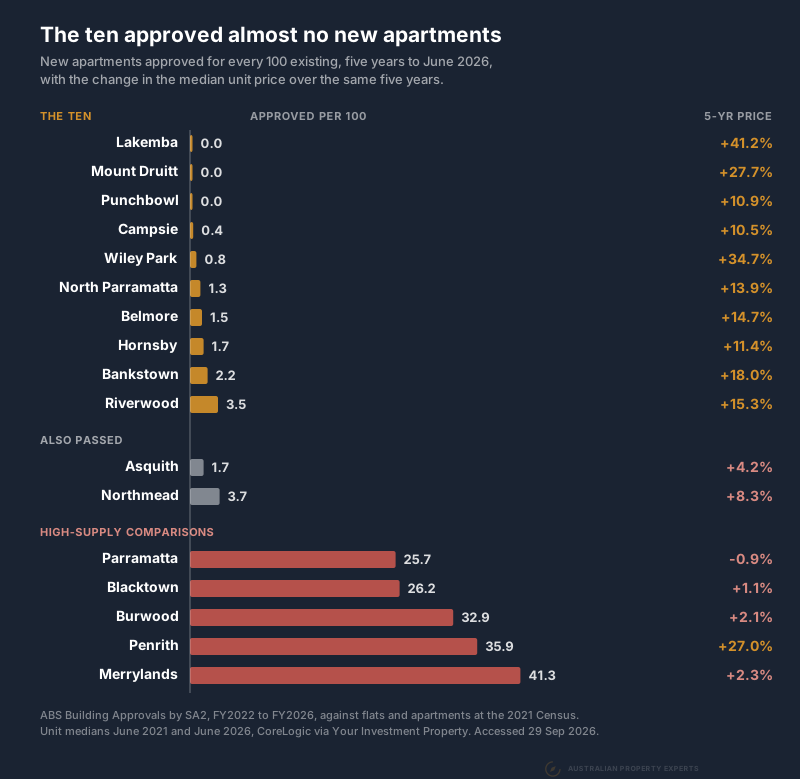
All ten have approved little new apartment supply, and in Sydney that has been a good guide to unit growth. We tracked 137 unit markets from 2021 to 2026. Where fewer than 5 new apartments per 100 had been approved between 2016 and 2021, units rose a median 16.8%. Where 20 or more had been approved, they rose 6.4%.
Five years ago a Lakemba unit cost $146,500 less than one in Merrylands. Today they sell for almost the same price, $540,000 and $541,000. Since mid-2016 Merrylands has approved 3,127 new apartments, almost as many as the 3,261 flats it had at the 2021 Census. Lakemba has approved 95 in that time.
How we screened 151 Sydney unit markets
We started with the 160 ABS areas of metropolitan Sydney that had 1,000 or more flats at the 2021 Census. Some suburbs span more than one area, so matching them to suburbs and adding a few smaller unit markets gave us 151. Each had to pass six tests.
- Affordable. A median unit price below Sydney’s median unit value of $878,176.
- A real gap to houses. Houses in the same suburb cost at least twice as much. For a lot of buyers, the unit is the realistic way in.
- Little new supply approved. Fewer than 5 new apartments approved for every 100 already there, over the five years to June 2026. The wider area had to stay under 10 per 100 as well. A tower one suburb over still competes for your tenants.
- A tight rental market. Vacancy at or below 1.71%, SQM’s figure for Sydney in August.
- Yield. A gross yield of at least 4.4%, the Sydney average for units.
- Enough sales. At least 50 unit sales in the past year, so the median means something.
Supply knocked out the most markets. Only 64 of the 151 passed it.
10 Sydney unit suburbs with low supply
The supply columns show new apartments approved for every 100 already there. Vacancy in all twelve sits between 0.65% and 1.40%.
| Suburb | Per 100, 2021-26 | Per 100, 2016-21 | 5-yr change | Unit median | Yield |
|---|---|---|---|---|---|
| Mount Druitt | 0.0 | 33.4 | +27.7% | $470,000 | 5.42% |
| Wiley Park | 0.8 | 7.0 | +34.7% | $525,500 | 5.24% |
| Lakemba | 0.0 | 2.8 | +41.2% | $540,000 | 5.30% |
| Punchbowl | 0.0 | 18.9 | +10.9% | $578,750 | 4.94% |
| Bankstown | 2.2 | 22.5 | +18.0% | $605,000 | 5.33% |
| Belmore | 1.5 | 26.2 | +14.7% | $662,500 | 4.55% |
| Riverwood | 3.5 | 1.0 | +15.3% | $670,000 | 5.36% |
| Campsie | 0.4 | 5.6 | +10.5% | $685,000 | 4.55% |
| North Parramatta | 1.3 | 4.9 | +13.9% | $694,500 | 4.64% |
| Hornsby | 1.7 | 7.1 | +11.4% | $735,000 | 4.56% |
| Also passed | |||||
| Northmead | 3.7 | 28.3 | +8.3% | $655,000 | 5.00% |
| Asquith | 1.7 | 63.1 | +4.2% | $719,000 | 5.06% |
North Parramatta and Northmead both pass the wider-area test at 9.9 per 100, the narrowest margin on the list. The Parramatta CBD area next door approved 1,869 apartments in five years.
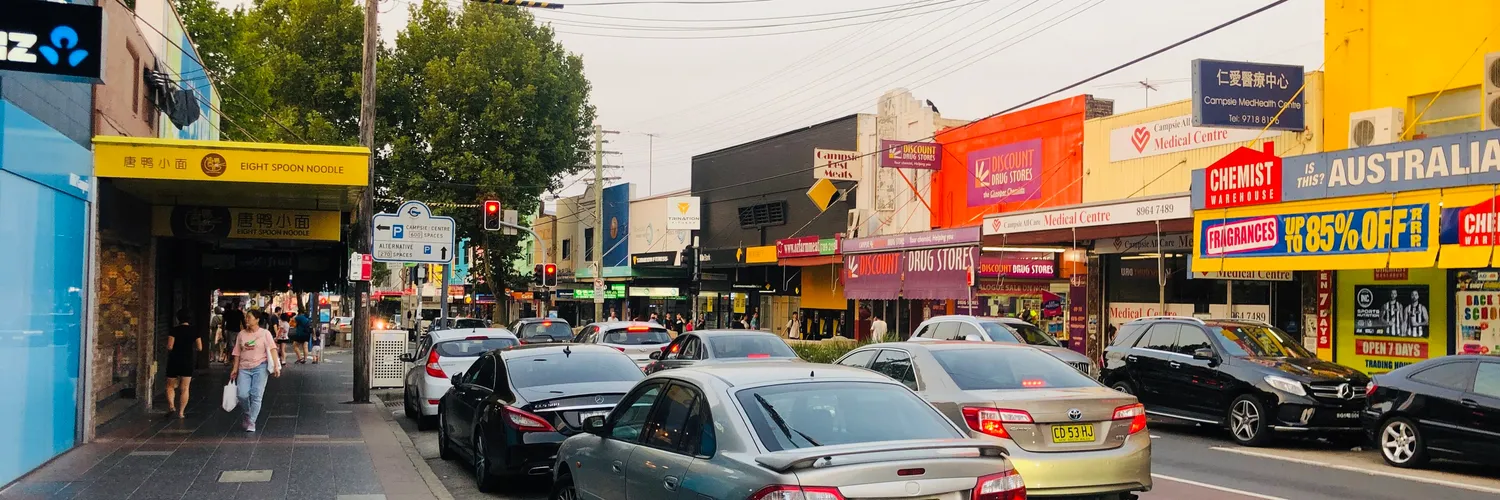
Campsie, Belmore, Lakemba, Wiley Park, Punchbowl and Bankstown all have a station on the Sydenham to Bankstown line, which is being converted to metro. The Canterbury area around the first five approved 231 new apartments in five years on top of 18,053 already there. That is about 1.3 per 100, against roughly 11 across Sydney.
Rents rose in all ten over the year, by 3.3% to 7.8%. Units sold in 17 to 27 days on average.
Among the near misses, Canterbury and Warwick Farm failed only on supply, and Penshurst and Mortdale only on yield.
Sydney is in a downturn. Cotality has dwelling values 7.1% below their February peak, with units falling less than houses. Tim Lawless says longer selling times, bigger vendor discounts and low clearance rates point to a buyer’s market. The medians in the table run to June, so most of the sales behind them came before that peak. Our Sydney property market update has the city-wide numbers.
Three kinds of low-supply unit market
The 2016-21 column shows the supply each market took on earlier. Many of those apartments were finished in the last five years.
Little supply then or now. Lakemba, Wiley Park, Campsie, Riverwood, North Parramatta and Hornsby approved fewer than 8 per 100 in both periods. Lakemba and Wiley Park posted the two biggest gains on the list. Riverwood is flat over ten years, at -0.3%. Its units fell 13.6% in the five years to 2021.
A big earlier wave, still growing. Mount Druitt approved 499 apartments between 2016 and 2021 and none since. Its units rose 27.7%. Vacancy is 0.65%. Bankstown, Belmore and Punchbowl approved between 18.9 and 26.2 per 100 and grew 10.9% to 18.0%, with vacancy below Sydney’s.
A big earlier wave, then a stall. The Asquith-Mount Colah area approved 987 apartments between 2016 and 2021, 63 for every 100 it had. Almost all its flats are in blocks of four to eight storeys. Asquith’s units rose 4.2% in five years. They took 48 days to sell. The Northmead statistical area took 28.3 per 100, but most of its flats are on the Westmead side. Northmead itself has about 1,400 flats. Its units rose 8.3%. Next door, the draft Westmead South rezoning allows up to 13,000 more homes.
How new supply hits Sydney unit prices
This covers the 137 markets with at least 1,000 flats and 50 unit sales in the year. It compares apartments approved between 2016 and 2021, many of them finished by 2026, with unit price growth from 2021 to 2026. Moving the window a year later gives the same pattern.
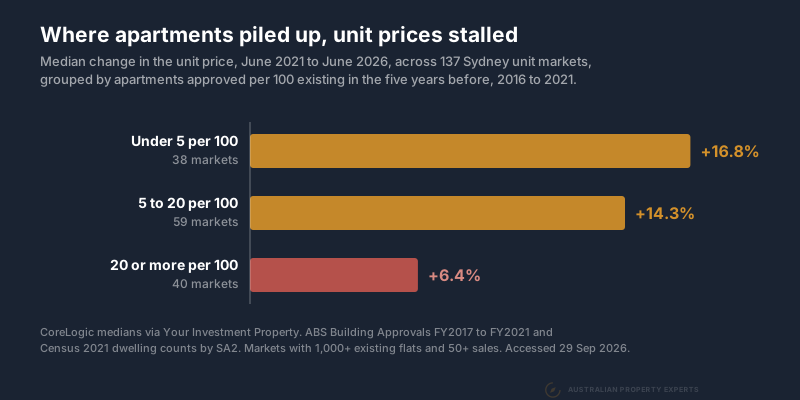
Markets with heavy supply were far more likely to post a weak result. Two in three of those approving 20 or more per 100 rose less than 10% over five years. For markets approving under 5, it was one in four. The heavy-supply markets had also lagged in the five years before. Part of the gap is the suburbs themselves.
The pattern has exceptions in both directions. Units in Pyrmont, Darlinghurst and Surry Hills fell even though each approved under 5 per 100. Penrith approved 2,586 apartments between 2016 and 2021, 76 for every 100 it had. Its units still rose 27.0%, and vacancy there is now 0.64%.
Supply bites harder on units than on houses because of land. Nobody can make more of it. A rezoning can lift an apartment site from three storeys to twenty, and each new building adds near-identical units for tenants to choose instead of yours. We set out five checks for any apartment purchase and traced this over a decade in ten years of Parramatta apartment prices.
What the price gap to houses tells you
Houses outgrew units in 118 of the 127 markets we could measure, so the gap between them widened almost everywhere. Across the ten, house medians rose a median 53.1% over five years against 15.0% for units. Bankstown went from 2.00 to 2.64 times.
Measured at the start of the five years, a wide gap came before faster unit growth across Sydney as a whole. Where houses cost at least 2.5 times the unit in June 2021, units rose a median 16.6%. Where they cost less than twice as much, units rose 11.1%. Most of that difference came from other things. Twenty-one of the 35 wide-gap markets were eastern, north shore or beachside suburbs with units over $1 million. Among markets under Sydney’s median unit price, a wide gap made no consistent difference.
So our screen asks for a gap of at least two times and gives no credit for a wider one. A very wide gap today often means the units have lagged, as it did when we ranked 38 Melbourne suburbs by their house to unit gap.
Rezoning plans near the ten
The Sydenham to Bankstown metro is due to open in the second half of 2026, according to Sydney Metro. The same corridor has been rezoned for more homes. New council planning rules took effect at Belmore and Lakemba in February 2026, under the state’s Transport Oriented Development program. Punchbowl and Wiley Park followed in April. The Bankstown precinct has been zoned for up to 14,000 new homes since November 2024. Campsie’s town centre plan, for 6,360 additional homes by 2036, went to the state for finalisation in June 2026.
Almost nothing has been approved along this line yet. The zoning now allows a lot more. That is the main thing that could change the supply picture for the six Bankstown line suburbs.
Hornsby’s precinct was rezoned for more than 6,000 homes in November 2024. North Parramatta has two precincts on its doorstep. Church Street North allows up to 1,800 homes from July 2024. The Parramatta North precinct, finalised in August 2026, allows around 2,000.
Where new apartments pay to build
Zoning only turns into buildings where the numbers work. The Centre for International Economics tested those numbers for every Sydney council area in a study for NSW Treasury. It measured how far a new block’s sale price clears its full cost plus a 20% developer margin.
Mid-rise blocks fall short in the Blacktown, Parramatta and Hornsby council areas, by 4.1%, 4.4% and 2.6%. In Blacktown even a 16-storey tower falls short. In Canterbury-Bankstown, mid-rise only just clears the bar at 3.1%, and 16-storey towers clear it by 8.8%. Riverwood is split between Canterbury-Bankstown and Georges River, where towers clear it by 22.1%.
Mount Druitt sits in the Blacktown council area. Its town centre was rezoned for mixed use and taller buildings in May 2020. No apartments have been approved there since the 441 approved in 2019 and 2020. Approvals are not completions, and the ABS series does not show how many of those were built.
At today’s costs we expect new supply to come slowly around Mount Druitt, Hornsby and North Parramatta. It is more likely to come along the Bankstown line and around Riverwood, where towers already pay.
What to check before you buy a unit
The suburb data gets you to a shortlist, but the building you pick decides how the purchase performs.
- The block. A walk-up or villa in a small block carries more land per unit than a tower apartment. In Lakemba, 93% of flats are in blocks of three storeys or fewer. In Bankstown, we would look at low-rise stock outside the rezoned precinct.
- Strata costs. Levies come straight out of the yield. Get the last four quarters of levies and the sinking fund balance before you offer. Our body corporate fees guide covers what a healthy fund looks like.
- Sites nearby. Check the council’s tracker for development applications within a few hundred metres. The NSW Planning Portal shows the zoning around the station.
- Vacancy direction. Compare two readings a year apart. Vacancy rose in seven of the ten postcodes behind the twelve, as it did across Sydney (1.38% to 1.71%). Riverwood, Campsie and Northmead tightened.
- The yield you will get. Hornsby clears the 4.4% bar at 4.56% on our calculation. On the figure Your Investment Property publishes, it misses at 4.38%. Work out the yield from the rent and price of the actual unit.
Where a unit fits in a portfolio
We start most portfolios with an established house on a decent block. Land is where most of the growth sits, and a house gives you more ways to add value. Houses in these ten suburbs cost $1,072,500 to $2,150,000. The units cost $470,000 to $735,000 and yield 4.55% to 5.42%, where the typical Sydney house yields 2.9%.
A unit suits a few specific jobs. Borrowing capacity may be tight. A portfolio may need cash flow to keep growing. Or an investor may want a foot in Sydney without the city’s $1.5 million median house price. Our capital growth versus rental yield piece covers how to balance the two. House or unit sets out the long-run record for each.
When we buy units for clients in Sydney, we look for older low-rise blocks in markets like these. Our Sydney buyers agent page covers how we buy across the city.
Supply is the test to run first
Across 137 Sydney unit markets, the ones that approved the most new apartments grew the least. These ten are affordable, yield at or above the Sydney average for units and have approved little new supply so far. The zoning along the Bankstown line now allows much more. That is where building approvals are likely to show it first, with vacancy close behind.
Data sources. Unit and house medians, weekly rents, sales counts and days on market are CoreLogic figures accessed through Your Investment Property. Medians and sales are to 30 June 2026 and rents to 31 August 2026. Every yield is computed by us as weekly rent times 52 divided by the median. Five-year changes compare the June 2021 and June 2026 annual medians. CoreLogic’s “units” include villas and townhouses on strata as well as apartments. New apartments per 100 is ABS Building Approvals by SA2 (new apartments only, townhouses excluded) divided by occupied flats and apartments at the 2021 Census, summed across the SA2s that best match each suburb. The 2021-26 figures are FY2022 to FY2026 and the 2016-21 figures are FY2017 to FY2021 from the ABS 2016-21 SA2 series, both on 2021 boundaries. For North Parramatta and Northmead the matching SA2 is two to three times the size of the suburb, taking in parts of Parramatta and Westmead. The wider-area test uses the SA3. Vacancy is SQM Research by postcode, which covers all rental dwellings, August 2026 against August 2025. Lakemba and Wiley Park share postcode 2195, and Asquith and Hornsby share 2077. City-wide values and yields are the Cotality Home Value Index to 31 August 2026, and the Sydney vacancy benchmark is SQM’s. Feasibility is from the CIE’s 2025 cost and feasibility estimates for NSW Treasury, published July 2026. Rezoning details are from the NSW Department of Planning, Housing and Infrastructure, Canterbury-Bankstown Council and Blacktown Council. All figures pulled 29 September 2026.
This is general information only and not financial advice. Speak to a qualified professional before making investment decisions.
If you want the building approvals and vacancy trend checked on a Sydney unit before you buy it, book a free discovery call.