To find the best Melbourne suburbs to buy units in 2026, we tested 153 Melbourne unit markets. Nine passed all seven tests. Eight of them are where we would start looking: Dandenong, Bundoora, Sydenham, Epping, Cranbourne, Pakenham, Noble Park and Point Cook. Median unit prices in the eight run from $494,500 to $615,000. Their units rose 18.7% to 34.1% over the five years to June 2026. Tullamarine also passes. Its units rose the least of the nine and its rents fell, so we list it separately.
Most of these are townhouse and villa unit markets. Building type has been the clearest divide in Melbourne. In the typical suburb with no flats in towers of nine storeys or more, units rose 12.2% over five years. Where towers hold 30% or more of the flats, they fell 5.3%. Seventeen of the 20 suburbs in that group lost value. None of the nine had a flat in a tower at the 2021 Census. Since 2021, seven have approved townhouses and no new apartments.
The price gap to houses pointed the same way. Unit prices fell in only 2 of 54 suburbs where a house cost less than 1.5 times the unit in 2021, against 23 of 30 where it cost 2.5 times or more. So we only kept suburbs where the house costs less than twice the unit.
How we tested 153 Melbourne unit markets
We matched Melbourne’s ABS areas to 206 suburbs. The 153 with 1,000 or more flats and townhouses at the 2021 Census made the list. We counted townhouses because in most of outer Melbourne they are the local unit market. Of the 153, 141 had 50 or more unit sales and a price record back to 2021. Those 141 are the base for the growth comparisons below. For the price gap, 138 also have a 2021 house median. Each suburb had to pass seven tests.
- Affordable. A median unit price at or below Melbourne’s median unit value of $629,054.
- A narrow gap to houses. Houses in the same suburb cost less than twice the unit. A narrow gap usually means a villa unit or townhouse with some land. Those have held their value best.
- No towers. No flats in buildings of nine storeys or more at the 2021 Census.
- Less new supply than Melbourne. Over the five years to June 2026, the suburb approved fewer new apartments and townhouses for every 100 it already had than the Melbourne rate of 18.2.
- A tight rental market. Vacancy at or below 1.78%, SQM Research’s figure for Melbourne in August.
- Yield. A gross yield of at least 4.4%, the median for Melbourne suburbs with 50 or more unit sales a year.
- Enough sales. At least 50 unit sales in the past year, so the median means something.
Price knocked out the most markets. Only 61 of the 153 have a unit median at or under $629,054.
Our 4.4% bar sits below the 5.1% Melbourne unit yield from Cotality, formerly CoreLogic. High yields in Melbourne have mostly come from falling prices. Of the 28 markets we could measure with 50 or more sales and yields above 5.1%, 25 lost value. Twenty-four of the 28 had tower stock. Dandenong and Bundoora are two of the three that rose.
8 Melbourne unit suburbs to start with
The supply columns show new apartments and townhouses approved for every 100 already there, over the five years to June 2026. House vs unit is the median house price divided by the median unit price. The wider area is the district the ABS groups the suburb into, usually a council area or part of one. Bundoora sits across two of these districts, so its figure combines both. Vacancy is SQM’s August 2026 figure for the postcode, with August 2025 in brackets.
| Suburb | New per 100, suburb | New per 100, wider area | Vacancy | Gross yield | Unit median | House vs unit | Unit price change, 2021-26 |
|---|---|---|---|---|---|---|---|
| Dandenong | 9.5 | 12.9 | 1.31% (1.00%) | 5.15% | $494,500 | 1.58x | +18.7% |
| Bundoora | 4.6 | 31.8 | 1.64% (1.31%) | 5.30% | $520,000 | 1.74x | +19.0% |
| Sydenham | 11.0 | 18.0 | 1.15% (1.21%) | 4.76% | $524,500 | 1.43x | +21.1% |
| Epping | 4.6 | 29.8 | 1.01% (0.76%) | 4.78% | $532,500 | 1.40x | +21.7% |
| Cranbourne | 12.8 | 46.9 | 1.48% (1.49%) | 4.79% | $543,000 | 1.33x | +31.8% |
| Pakenham | 16.4 | 26.7 | 1.41% (1.39%) | 4.73% | $550,000 | 1.31x | +34.1% |
| Noble Park | 11.5 | 12.9 | 1.41% (0.81%) | 4.44% | $609,000 | 1.38x | +21.8% |
| Point Cook | 8.4 | 27.9 | 1.74% (2.28%) | 4.48% | $615,000 | 1.37x | +22.1% |
| Also passed | |||||||
| Tullamarine | 13.0 | 34.2 | 1.16% (1.49%) | 4.80% | $595,550 | 1.39x | +13.4% |
Two pass by a whisker. Point Cook’s vacancy was 1.74% in August, under Melbourne’s 1.78%, but it averaged 2.00% over the past year, against 1.71% for Melbourne. Noble Park’s 4.44% yield clears the bar by 0.04 points.
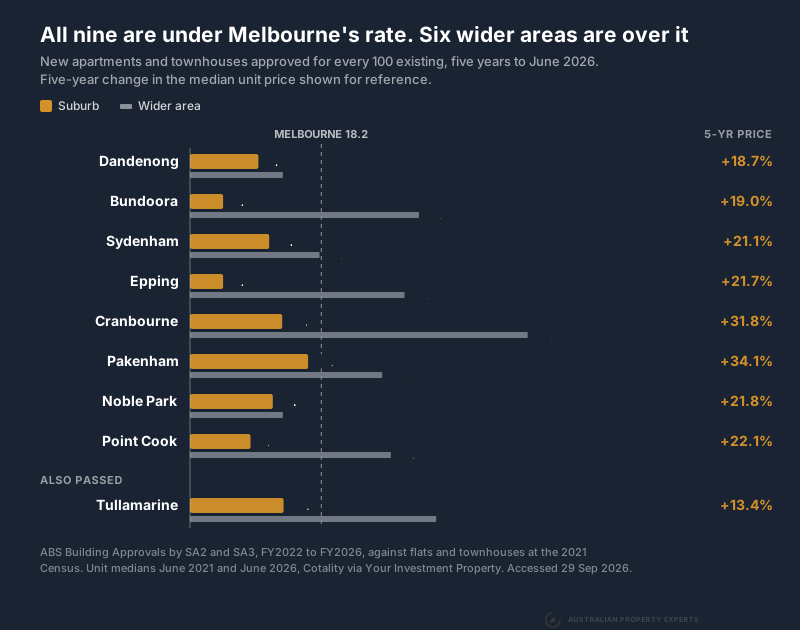
In six of the nine, the wider area approved new apartments and townhouses faster than the Melbourne rate, from 26.7 per 100 around Pakenham to 46.9 around Cranbourne. Most of that is new estates on the city’s edge, such as Clyde North near Cranbourne, Officer near Pakenham, Wollert near Epping and Tarneit near Point Cook. Around Bundoora, much of it is new apartments in Heidelberg West.
We report the wider area without testing it. Take the 67 suburbs with no towers where houses cost under twice the unit in 2021. There, a busy wider area went with faster price growth and slower rent growth. With the wider area under the Melbourne rate, units rose a median 11.7% over five years and rents 5.8% over the last year. Above it, units rose 16.4% and rents 2.6%.
Eight of the nine follow that pattern. Rents rose 1.0% to 2.1% in Epping, Cranbourne, Pakenham and Point Cook, next to the estates. They fell in Tullamarine. In Dandenong, Noble Park and Sydenham they rose 3.2% to 6.5%. Bundoora is the exception. Its rents rose 6.0% even though its wider area is over the rate. Treat the four estate-side suburbs as carrying more rental risk than their own supply figures show.
Tullamarine passes every test but has the weakest record of the nine. Over five years its units rose 13.4%, against 20.8% for houses. Rents fell 1.8% in the last year. The median rests on 66 sales.
Melbourne is in a downturn. Cotality has dwelling values down 4.7% over the year to August and 6.8% below their March 2022 peak. Units fell 2.5% over the year and houses 5.7%. The table’s medians cover sales from July 2025 to June 2026, so units today may sell a little below them. Our Melbourne property market update has the city-wide numbers.
Melbourne unit suburbs that just missed
Several markets failed just one test. These four had the strongest unit price growth over the five years to June 2026.
| Suburb | Missed on | Vacancy | Gross yield | Unit median | House vs unit | Unit price change, 2021-26 |
|---|---|---|---|---|---|---|
| Langwarrin | Price | 0.34% (0.40%) | 4.45% | $666,500 | 1.37x | +30.7% |
| Thomastown | Yield | 1.24% (1.20%) | 4.20% | $606,250 | 1.30x | +29.0% |
| South Morang | Supply | 1.32% (1.45%) | 4.84% | $569,000 | 1.44x | +27.0% |
| Dandenong North | Yield | 1.31% (1.00%) | 4.37% | $606,250 | 1.34x | +26.3% |
Dandenong North shares its postcode with Dandenong, so their vacancy figures match. Langwarrin’s vacancy of 0.34% is among the lowest in the study. Its units now cost about $37,000 more than Melbourne’s median unit value.
Thomastown and Dandenong North miss on yield by our calculation, a year’s rent divided by the median price. On the yields Your Investment Property publishes, both pass, at 4.64% and 4.55%. So would five more that fail on yield alone: Mill Park, St Albans, Hastings, Altona Meadows and Sunshine West. Mill Park misses ours by 0.01 points. Treat all seven as near passes.
South Morang approved 594 new townhouses in five years on top of 1,246 flats and townhouses, 47.7 for every 100. Its units still rose 27.0%. Check what is being built nearby before buying there.
Some familiar unit markets missed for other reasons.
| Suburb | Why it missed |
|---|---|
| Werribee | Supply: 909 new apartments and townhouses on 2,912, or 31.2 per 100 |
| Broadmeadows | Supply: 43.0 per 100 |
| Craigieburn | Vacancy: 3.67% |
| Hoppers Crossing, Tarneit | Vacancy: 3.25% in postcode 3029, down from 4.55% a year ago. Tarneit also failed on supply |
| Reservoir | Price ($671,000) and yield (4.18%) |
| Springvale | Price ($690,000) and yield (4.14%) |
| Glenroy | Price ($650,000) and supply (18.6 per 100) |
| Preston | Price ($630,000), supply (35.2 per 100) and some tower stock |
| Frankston | Supply (20.0 per 100), yield (4.33%) and some tower stock |
| Footscray, Sunshine, Box Hill | Tower stock and heavy supply. Units fell 8.6%, 8.7% and 1.8% |
| Melton | Too few flats and townhouses to include (503) |
Among the 61 markets under Melbourne’s median unit price, towers and the price gap each knocked out 31, supply 21 and vacancy 19.
Premium Melbourne units like Toorak
The price test keeps this list affordable. It also rules out Toorak, Malvern and most of Melbourne’s blue-chip unit markets. Each one below fails on more than price.
| Suburb | Unit median | House vs unit | Unit price change, 2021-26 | Also failed on |
|---|---|---|---|---|
| Toorak | $970,000 | 5.11x | -28.1% | Gap, towers, vacancy, yield |
| Malvern | $785,000 | 3.44x | -13.8% | Gap, vacancy, yield |
| Armadale | $701,000 | 3.27x | -12.2% | Gap |
| Caulfield North | $665,000 | 3.65x | -10.1% | Gap, towers, vacancy |
| Glen Iris | $744,000 | 3.31x | -4.6% | Gap, towers, vacancy, yield |
| Brighton | $1,247,500 | 2.61x | +11.4% | Gap, towers, supply, vacancy, yield |
Hawthorn, South Yarra and Carlton pass on price, with unit medians from $320,000 to $582,000. They fail on the gap, towers and vacancy. All ten suburbs with the widest house to unit gaps in our gap ranking lost value over five years. Our blue chip units post covers their yields.
As a group, premium units have outgrown cheaper ones. Across the 141 markets with a five-year record, the 84 above Melbourne’s median unit price rose a median 6.6% and the 57 below it 2.1%. The cheapest units include many inner-city apartments that fell. The building test works at the top end too. The 42 premium markets with no towers and houses under twice the unit rose a median 11.7%, against 1.9% for the other 42 premium markets.
Most of the low-rise group yield under 4.4%. Bentleigh units rose 23.8% and Seaford’s 25.4%, on yields of 3.73% and 4.00%. They suit an investor chasing growth more than cash flow. Hampton sits just outside the low-rise group, with houses at 2.02 times the unit. Its units rose 39.8%, the most of any market above the median, on a 3.40% yield.
Drop the price test and three suburbs join the nine: Langwarrin, Ferntree Gully and Clayton South, with unit medians from $645,000 to $709,000. Ferntree Gully’s yield only just clears the bar.
How fast listings sell by postcode
Approvals show what is coming, and the share of listings still unsold after 90 days shows whether buyers are taking what is already for sale. SQM counts every listing in a postcode and how long it has sat, across all dwelling types. The higher the share, the more room buyers have to negotiate.
| Postcode | Listings unsold after 90 days | Change in listings over the year |
|---|---|---|
| Dandenong 3175 | 38.2% | 0% |
| Bundoora 3083 | 42.6% | -7% |
| Sydenham 3037 | 27.1% | +4% |
| Epping 3076 | 25.9% | +16% |
| Cranbourne 3977 | 23.6% | +14% |
| Pakenham 3810 | 43.8% | +89% |
| Noble Park 3174 | 36.1% | +4% |
| Point Cook, Werribee 3030 | 37.8% | +44% |
| Tullamarine 3043 | 23.1% | -16% |
| Melbourne | 38.4% | +22% |
| Melbourne CBD 3000 | 60.4% | +13% |
| Docklands 3008 | 53.6% | +19% |
| Box Hill 3128 | 64.9% | +7% |
Seven of the nine postcodes sit below Melbourne’s 38.4%, Dandenong only just. Bundoora and Pakenham sit above it, at 42.6% and 43.8%. The 90-day share covers all dwellings. For units alone, the average time to sell over the year ran from 14 days in Cranbourne and Pakenham to 33 in Point Cook.
Pakenham’s listings nearly doubled in a year, from 573 to 1,084, while its median unit price rose 12.7% over the year to June 2026. It approved more new townhouses over the five years (402) than any other suburb that passed. Part of any rise in its median can come from newer stock selling. Listings in 3030, which covers Point Cook and Werribee, are up 44%. Buyers in both have more choice than a year ago, so recheck vacancy and days on market before making an offer.
Most of these postcodes cover more than one suburb. Cranbourne’s 3977 takes in Cranbourne East, West and North. Sydenham’s 3037 includes Delahey, Hillside and Taylors Hill. Dandenong’s 3175 includes Dandenong North. Small postcodes swing on a handful of listings. Tullamarine’s figure rests on 52.
The two highest shares of any postcode we checked are tower markets. In Box Hill, 64.9% of listings have been for sale for more than 90 days, and in the CBD 60.4%.
The house to unit price gap in Melbourne
Many investors look for a unit priced well below the local house as a cheaper way into a suburb. Across the 138 Melbourne markets we could measure from June 2021, units did better the narrower the gap.
| Houses cost, June 2021 | Median unit change, 2021-26 | Markets that lost value |
|---|---|---|
| Under 1.5 times the unit | +14.8% | 2 of 54 |
| 1.5 to 2 times | +3.3% | 7 of 31 |
| 2 to 2.5 times | -1.6% | 12 of 23 |
| 2.5 times or more | -4.9% | 23 of 30 |
Narrow gaps also beat wide ones from 2016 to 2021. Units where houses cost under 1.5 times rose a median 35.1% in those five years, against 22.5% where houses cost 2.5 times or more. None of the wide-gap suburbs fell then. In both periods a wide gap meant slower growth, and only in the last five years has it also meant falling prices.
The likely reason is the kind of unit being sold. A unit priced close to the local house is usually a villa unit or townhouse with some land of its own. A wide gap usually means an apartment in a suburb of expensive houses. We covered the wide end in detail when we ranked 38 Melbourne suburbs by their house to unit gap. Sydney is different. There a wide gap mostly marked expensive eastern and north shore suburbs whose units grew, so our Sydney screen asks for a gap of at least two times.
We drew the line at two times because most markets between 1.5 and 2 still rose, while most above 2 fell. Two of the eight were in that band in 2021, Dandenong at 1.58 and Bundoora at 1.85. Their units rose 18.7% and 19.0%. The other six were under 1.5.
How towers and supply hit unit prices
This covers the 141 markets, grouped by how many of their flats were in towers at the 2021 Census.
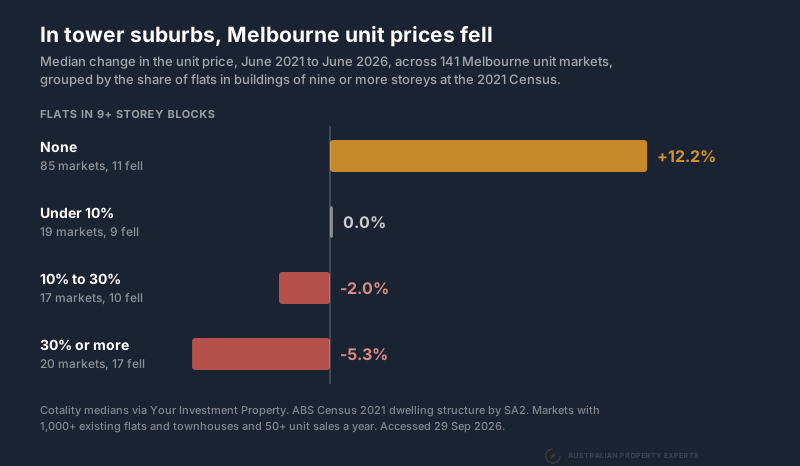
With no flats in towers, units rose a median 12.2% and 11 of 85 markets fell. In the 20 markets where 30% or more of flats were in towers, 17 fell. Those 20 include the CBD, Southbank, Docklands, Box Hill and Doncaster.
Part of this is location. Tower suburbs are mostly inner-city and expensive, and expensive suburbs lagged for houses too. Where the house median is $2 million or more, houses rose 2.3% in five years, against 18.6% where it is under $850,000. The tower markets also lagged before the pandemic. From 2016 to 2019, units rose a median 16.5% with no towers and fell 0.3% where 30% or more of flats were in towers.
Past supply points the same way, on fewer markets. Counting apartments only, 72 markets have 1,000 or more flats. Units rose a median 6.5% over the next five years in the 10 that approved fewer than 5 new apartments per 100 from 2016 to 2021. They fell 2.6% in the 35 that approved 20 or more. The ABS counts approvals, and not every approved project gets built.
Melbourne approves a lot of units for its size. It approved 53,624 apartments in the five years to June 2026 against 277,461 existing flats, about 19 per 100. Sydney’s figure was about 11. Add Melbourne’s 49,572 townhouses and the combined rate is the 18.2 used in our supply test. Our Sydney thresholds passed no Melbourne market at all. So the price, supply, vacancy and yield bars here are Melbourne’s own.
New supply still mattered in suburbs with no towers and houses under twice the unit price in 2021. Across those 67 markets, units rose a median 17.7% where fewer than 10 new apartments and townhouses were approved per 100. Between 10 and the Melbourne rate they rose 13.4%, and above it 12.1%. Bundoora, Dandenong, Epping and Point Cook are all under 10. Our five checks for any apartment purchase cover how to read supply around a single building.
Where rezoning could add unit supply
Noble Park, Dandenong and Epping are in Victoria’s activity centres program, which rezones land around train stations for more homes. Noble Park and Dandenong are two of 50 station centres the state says will help deliver more than 300,000 homes by 2051. Their new planning rules took effect on 22 July 2026. Most of the Dandenong centre’s core has no height limit, and development plans for some central sites allow up to 45 storeys.
Epping was one of the first ten centres, rezoned in 2025 as part of a plan for 60,000 homes across them. Up to 12 storeys are allowed around the station and town centre, and 3 to 6 storeys in the streets within walking distance. Little of this shows in approvals yet. Epping approved no new apartments in the five years to June 2026, including the year after its rezoning. Twelve storeys would count as a tower on our test. If towers go up near the stations in Dandenong, Noble Park or Epping, the 2021 count behind this list stops holding. Check approvals within walking distance of the station before you buy.
Townhouse permits have also got easier across Victoria. Since March 2025, Victoria’s Townhouse and Low-Rise Code has applied to new applications for units, townhouses and apartment buildings of up to three storeys. A design that meets the code’s standards is taken to meet the planning objectives they cover, which is meant to speed up permits. That means more new townhouses competing with yours for tenants and buyers. Around Cranbourne, Pakenham and Point Cook, most are likely to come from the estates nearby.
What to check before you buy a unit
The suburb data gets you to a shortlist, but the building you pick decides how the purchase performs.
- The title and the land. Check the plan of subdivision for how many lots share the site and whether the courtyard is yours or common property. Townhouses outnumber flats in eight of the nine suburbs. In Noble Park, the exception, 98% of flats are in blocks of three storeys or fewer.
- Owners corporation fees. Fees come straight out of the yield. Get the last two years of fees and minutes before you offer. In a small villa block there may be no maintenance fund, so check who insures the building and how shared repairs have been paid. Our body corporate fees guide covers what a healthy fund looks like.
- Sites nearby. Check the council’s planning register for new townhouse and apartment permits within a few hundred metres. VicPlan shows the zoning around the station.
- Vacancy direction. Compare two readings a year apart. Vacancy rose over the year in Noble Park (0.81% to 1.41%), Bundoora, Dandenong and Epping. It fell in Point Cook, Tullamarine and Sydenham, and barely moved in Pakenham and Cranbourne.
- Recent sales like yours. A suburb median moves with what sells. Compare the unit with recent sales of similar age and size.
- The yield you will get. Your Investment Property’s figure for Tullamarine is 5.52%, against 4.80% on our calculation. Work out the yield from the rent and price of the actual unit.
Where a unit fits in a portfolio
We start most portfolios with an established house on a decent block, because over the long run land is where most of the growth sits. These eight have gone the other way lately. Units outgrew houses in seven of them over five years. In Epping, units trailed houses by 0.3 points. Across Melbourne, houses outgrew units in 87 of the 138 markets we could measure.
The units cost $494,500 to $615,000 and yield 4.44% to 5.30%. Houses in the same suburbs cost $720,000 to $905,000 and yield 3.45% to 4.12%. A unit makes sense when borrowing is tight or a portfolio needs cash flow. If the house is within reach, price both. Our capital growth versus rental yield piece covers the trade-off, and our house or unit guide has the long-run record.
When we buy units for clients in Melbourne, we look for villa units and townhouses in low-rise suburbs like these. Our Melbourne buyers agent page covers how we buy across the city.
Building type is the test to run first
Across Melbourne’s unit markets, towers and wide price gaps marked most of the markets that fell, so start with what the unit is and what sits around it. These eight are affordable, low-rise and have approved fewer new units than Melbourne as a whole. The new zoning around Noble Park, Dandenong and Epping allows towers, and the estates around Cranbourne, Pakenham and Point Cook keep adding townhouses. Check what has been approved nearby, then the vacancy trend.
Data sources. Unit and house medians, weekly rents, sales counts and days on market are Cotality (formerly CoreLogic) figures accessed through Your Investment Property. Medians and sales are to 30 June 2026 and rents to 31 August 2026. Every suburb yield in the tables is computed by us as weekly rent times 52 divided by the median. The published yields quoted for comparison are Your Investment Property’s. Five-year changes compare the June 2021 and June 2026 annual medians, and the earlier comparisons use the June 2016 and June 2019 medians. Cotality’s “units” include villa units and townhouses as well as apartments. New apartments and townhouses per 100 is ABS Building Approvals by SA2 (new apartments, plus semi-detached, row, terrace and townhouses) divided by occupied flats and apartments plus semi-detached, row, terrace and townhouses at the 2021 Census, summed across the SA2s that make up each suburb. The wider area uses the SA3. The 2021-26 figures are FY2022 to FY2026. The 2016-21 apartment figures are FY2017 to FY2021 from the ABS 2016-21 SA2 series, on 2021 boundaries. Tower stock is the 2021 Census count of occupied flats by storeys in the block. Metro Melbourne totals are ABS Building Approvals for Greater Melbourne. Vacancy is SQM Research by postcode, which covers all rental dwellings, August 2026 against August 2025, with the 12-month average from the same series. Stock on market is SQM’s total listings by postcode for August 2026 against August 2025, all dwelling types, with the 90-day share taken from its listing-age breakdown. City-wide values and yields are the Cotality Home Value Index to 31 August 2026, and the Melbourne vacancy figures are SQM’s, for August 2026 and the 12 months from September 2025 to August 2026. Activity centre details are from the Victorian Department of Transport and Planning, Engage Victoria, the Premier of Victoria, Greater Dandenong Council and ABC News. The Townhouse and Low-Rise Code dates are from Manningham Council. All figures pulled 29 September 2026.
This is general information only and not financial advice. Speak to a qualified professional before making investment decisions.
If you want the townhouse approvals and vacancy trend checked on a Melbourne unit before you buy it, book a free discovery call.